
- Title
-
Cell competition corrects noisy Wnt morphogen gradients to achieve robust patterning in the zebrafish embryo
- Authors
- Akieda, Y., Ogamino, S., Furuie, H., Ishitani, S., Akiyoshi, R., Nogami, J., Masuda, T., Shimizu, N., Ohkawa, Y., Ishitani, T.
- Source
- Full text @ Nat. Commun.

Apoptotic elimination of unfit cells smoothens the Wnt/β-catenin gradient. a Schematic illustration of Wnt/β-catenin activity gradient formation. A: anterior, P: posterior. b Caspase-3 activation in unfit cells with abnormal Wnt/β-catenin activity. Whole-mount immunostaining of d2EGFP (green) and active caspase-3 (magenta) in Tg(OTM:d2EGFP) zebrafish embryos (Dorsal view). Dotted line indicates abnormal Wnt/β-catenin-reporter activity. Scale bars, 200 μm. c OTM:ELuc-CP drives destabilized ELuc-CP expression in response to Wnt/β-catenin signalling activation in reporter embryo (dorsal view). Scale bar, 200 μm. (See also Supplementary Movie 1). dTime lapse images showing unfit cells with abnormal Wnt/β-catenin activity appear then disappear in OTM:ELuc-CP embryos. Scale bars, 100 μm. Pixel area length is 6.5 μm, ≤ zebrafish deep cell diameter (~10 μm). e Physiological Wnt/β-catenin-noise during zebrafish AP axis formation. Graphs show the number of pixels with unfit Wnt/β-catenin activity in the luminescence images of living OTM:ELuc-CP transgenic zebrafish embryos during AP axis formation. Schematic illustrations: pixel retaining >two-fold or <two-fold intensity compared to neighbouring pixels for ≥frames (>6 min) was defined as High or Low noise, respectively. Pixels retained for ≥two frames were counted as the physiological Wnt/β-catenin noise. Pixels spontaneously showing abnormally high or low activity within one frame were regarded as other noise (e.g., cosmic rays and detector noises) and excluded. f Apoptosis inhibition enhances unfit abnormally high or low Wnt/β-catenin activity cell appearance. Whole-mount in situ hybridization of d2EGFP in Tg(OTM :d2EGFP) embryos (dorsal view). p < 0.01 (Fisher’s exact test). Scale bar, 200 μm. |
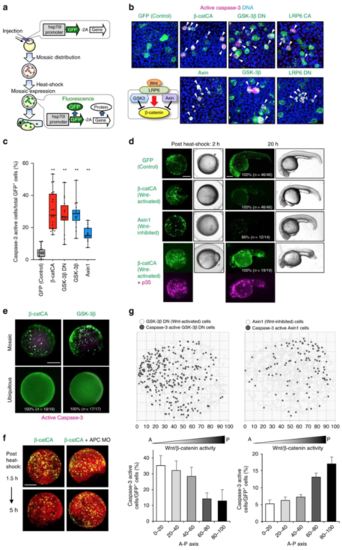
Substantial difference in Wnt/β-catenin activity between unfit and neighbouring cells triggers unfit cell apoptosis. a Schematic illustration of experimental introduction of fluorescent Wnt/β-catenin-abnormal cells in zebrafish early embryo through heat shock induction. b, c Artificially introduced Wnt/β-catenin-abnormal cells undergo apoptosis. Confocal microscopy images showing whole-mount immunostaining of active caspase-3 (magenta) in mosaic embryos expressing membrane GFP ± Wnt activators or inhibitors. Scale bar, 50 μm. Arrowheads indicate caspase-3-active cells. c Box plots of GFP+ caspase-3-active cell frequencies show 75th, 50th (median), and 25th percentiles (right). Whiskers indicate minimum and maximum. Each dot represents one embryo ( n = 23, 21, 16, 17 and 16 embryos, two or more independent experiments). ** p < 0.01 (one-way ANOVA). dEmbryos artificially introduced with cells expressing membrane GFP alone (GFP) or with β-catCA or Axin1 with or without caspase inhibitor p35. Fluorescence and bright-field images after heat-shock. p35 expression (magenta). Scale bar, 200 μm. (See also Supplementary Movies 3 and 4). eSurrounding normal cells are required for apoptosis induction of β-catCA- or GSK-3β-overexpressing cells. [Tg(hsp70l:GFP-T2A-β-catCA)] or [Tg(hsp70l:GFP-T2A-GSK-3β)] transgenic lines were exposed to heat shock. Percentages of embryos showing similar phenotype and number of embryos are shown. Scale bar, 200 μm. f Alleviation of Wnt/β-catenin activity difference between β-catCA-overexpressing cells and surrounding normal cells by injecting APC MO blocks β-catCA-overexpressing cell elimination. Cell membrane was visualized by injecting membrane-tagged mKO2 mRNA (red). Scale bar, 200 μm. g Cells causing excess noise in Wnt/β-catenin-gradients efficiently undergo apoptosis. Top panels show the maps of artificially introduced cells in zebrafish embryos. Bottom graphs show the means ± SEM of caspase-3-active cell frequencies within the divided range along the AP axis (GSK-3βDN, n = 8 embryos, 1131 cells; Axin1, n = 14 embryos, 1308 cells). |

ROS kills unfit cells downstream of cadherin and Smad signalling. aRepresentative confocal images showing whole-mount immunostaining of Sephs1 (magenta) in mosaic embryos expressing membrane GFP ± β-catCA or GSK3β (green). Scale bar, 50 μm. b, c Cells with unfit Wnt/β-catenin activity activate ROS production through E-cadherin and Smad signaling. bFluorescence images showing ROS probe (CellRox Green)-stained mosaic embryos expressing membrane mKO2 ± indicated genes. Scale bars, 200 μm. c Confocal images showing whole-mount immunostaining of 8-OHdG (magenta) in mosaic embryos expressing membrane GFP ± indicated genes (green). Arrowheads indicate 8-OHdG-positive oxidized nuclei. Scale bar, 50 μm. Box plots of fluorescence intensity of 8-OHdG staining show 75th, 50th (median) and 25th percentiles (right). Whiskers indicate minimum and maximum. Each dot represents one embryo. ( n = 40 or more cells, two independent experiments) ** p < 0.01, * p < 0.05 (one-way ANOVA). d ROS downregulation blocks Wnt-activated or -inhibited cell apoptosis. Confocal images showing whole-mount immunostaining of active caspase-3 (magenta) in mosaic embryos expressing membrane GFP ± β-catCA- or Axin1 (green) and injected with SOD1 or sephs1 mRNA. Arrowheads indicate caspase-3-active cells. Scale bar, 50 μm (left). Graphs show the means ± SEM ( n = 5 or 6 embryos, two independent experiments) of GFP+ caspase-3-active cell frequencies (right). ** p < 0.01, * p < 0.05 (one-way ANOVA). e Cells with unfit Wnt/β-catenin activity r educe Bcl-2 protein levels. Confocal images of mosaic embryos expressing membrane mKO2 ± β-catCA- or Axin1 (magenta) and injected with GFP-Bcl2 mRNA. Scale bar, 50 μm (left). Graphs show the means ± SEM (n = 16 or more cells, two independent experiments) of fluorescence intensity of GFP-Bcl-2 (right). ** p < 0.01, * p < 0.05 (one-way ANOVA). |
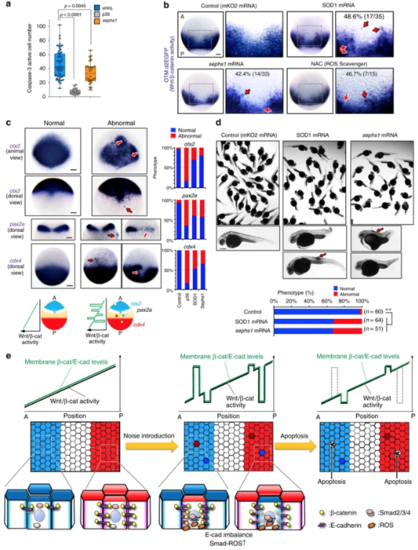
Apoptotic elimination of unfit cells is required for precise tissue patterning. a Sephs1 overexpression partially reduces physiologically occurring apoptosis in embryos as determined by caspase-3 immunostaining. Box plots of caspase-3-active cell number per embryo at 10 hpf stage show 75th, 50th (median) and 25th percentiles. Whiskers indicate minimum and maximum. Each dot represents one embryo ( n = 28 embryos, two independent experiments). **** p < 0.0001, ** p < 0.045 (one-way ANOVA). bInhibiting ROS production distorts the Wnt/β-catenin-gradient. Whole-mount in situ hybridization of d2EGFP in Tg(OTM:d2EGFP) embryos (dorsal view) injected with mKO2 (control), SOD1, or sephs1 mRNA (800 pg) or treated with 100 μM NAC. Magnification of boxed area (black line) (right). Embryo percentages and numbers with similar expression patterns are shown. Red arrows: ectopic activation or inactivation areas. Scale bar, 200 μm. p < 0.05 for NAC treatment versus control; p < 0.01 for SOD1 or sephs1 mRNA versus control (Fisher’s exact test). c Inhibition of ROS-mediated apoptosis distorts AP patterning. Panels show whole-mount in situ hybridization of otx2(marker of presumptive forebrain and midbrain), pax2a (marker of presumptive midbrain-hindbrain boundary), and cdx4 (marker of presumptive spinal cord) in embryos uninjected or injected with mKO2(control), p35, sephs1, or SOD1 mRNA (800 pg). Scale bar, 200 μm. Bottom schematic illustration indicates expression pattern of AP tissue markers. Right graphs show percentages of embryos with normal or abnormal expression patterns. In abnormal embryos, a posterior marker ( cdx4) and anterior markers ( pax2a and otx2) are ectopically activated in the anterior and posterior areas, respectively. d Overexpression of SOD1 or sephs1 mRNA induces abnormal morphogenesis. Images show 32 hpf zebrafish larvae uninjected or injected with SOD1 or sephs1 mRNA (800 pg). Red arrow indicates abnormal cell proliferation. Scale bar, 500 μm. Percentages of embryos with normal or abnormal morphology are shown. The numbers shown above the graph indicate the total numbers of embryos analysed. ** p < 0.01 (Fisher’s exact test). Note that a portion of embryos showed the anteriorization-related phenotype (e.g. short trunk and tail) or posteriorization-related phenotype (e.g. head- and eye-size reduction). A small number of embryos generated a tumour-like cell mass (arrows). eSchematic diagram of the Wnt/β-catenin-noise cancelling system. See also Supplementary Fig. 7 |

Wnt/β-catenin signalling reporter properties. Related to Fig. 1. a Schematic diagrams of two Wnt/β-catenin signalling-reporter constructs: OTM:d2EGFP and OTM:ELuc-CP. Tcf/Lef BS: consensus sequence of the Tcf/Lef-binding site; EGFP: enhanced green fluorescent protein; ELuc: Emerald Luciferase; PEST: degradation sequence derived from mouse ornithine decarboxylase; CL1: degradation sequence derived from yeast; Poly A: SV40 polyadenylation sequence. b OTM:ELuc-CP drives ELuc-CP expression in mouse neuro-2a cells in response to the activation of Wnt/β-catenin signalling. Neuro-2a cells were transfected using a reporter construct with a titrated amount of an expression plasmid-encoding Lef1 CA. Then, luciferase activity was measured. c The half-life of ELuc-CP is approximately 15 min. Neuro-2a cells were transfected using a reporter construct. After 36 hours, cells were treated with 100 ng/ml cycloheximide (CHX) for the indicated times. Then, luciferase activity was measured. The error bars indicate the standard deviations. d The OTM:ELuc-CP-transgenic zebrafish line carries a single copy of the OTM:ELuc-CP reporter. Southern blot analysis of the transgenes in the OTM:ELuc-CP transgenic zebrafish line. Genomic DNA was prepared from the tail fins of this line and used for Southern blot analysis. e OTM:ELuc-CP and OTM:d2EGFP are activated in same areas of zebrafish embryos. Left panel shows d2EGFP fluorescence (green) merged with bright-field of OTM:d2EGFP-transgenic zebrafish at 30 hpf (left view with the anterior side to the left). Right panel shows whole mount in situ hybridization of eluc-cp (blue) in OTM:ELuc- CP-transgenic zebrafish at 30 hpf (left view with the anterior side to the left). Scale bar, 200 μm. f, g Expression gradient of a Wnt/β-catenin-target gene lef1 is noisy during zebrafish AP axis formation and lef1 expression-noise correlates with OTM:d2EGFP reporter-noise. Confocal images showing wholemount fluorescence in situ hybridization with lef1 and gfp mRNA of wild-type (f) or OTM:d2EGFP (g) embryos. f Panels show fluorescence intensity and the magnified views of the noise areas. Scale bar, 20 μm. Left bottom graph shows lef1 mRNA levels in the area indicated in left top panel dot line. g Naturally generated unfit Wnt/β-catenin cells (unfit cells with abnormally high or low OTM:d2EGFP activity) are enclosed with yellow dotted line circles. h, i Gradient of endogenous nuclear β-catenin protein levels is noisy during zebrafish AP axis formation and nuclear β-catenin-noise correlates with OTM:d2EGFP reporter-noise. Confocal images showing whole-mount immunostaining of β-catenin in wild-type (h) or OTM:d2EGFP (i) embryos. h Panels show fluorescence intensity and the magnified views of the noise areas. Scale bar, 20 μm. Graph shows β-catenin protein levels in the area indicated in left top panel dotted line. i Naturally generated unfit Wnt/β-catenin cells (unfit cells with abnormally high or low OTM:d2EGFP activity) are indicated with arrow heads. |