FIGURE SUMMARY
Title

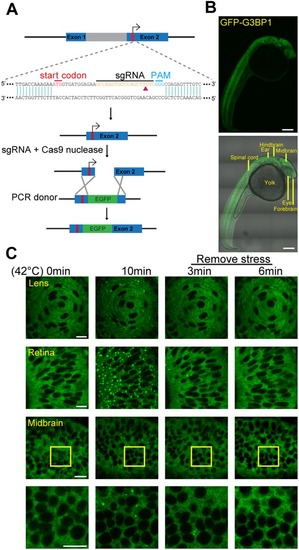
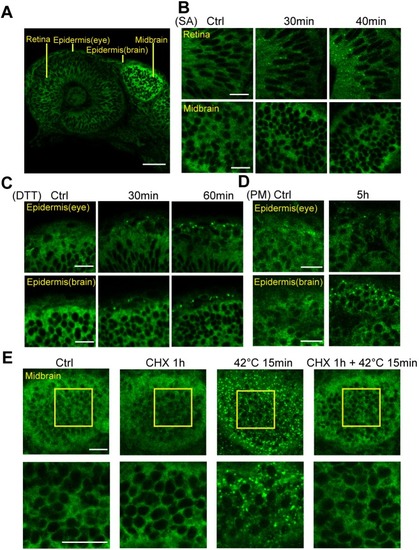
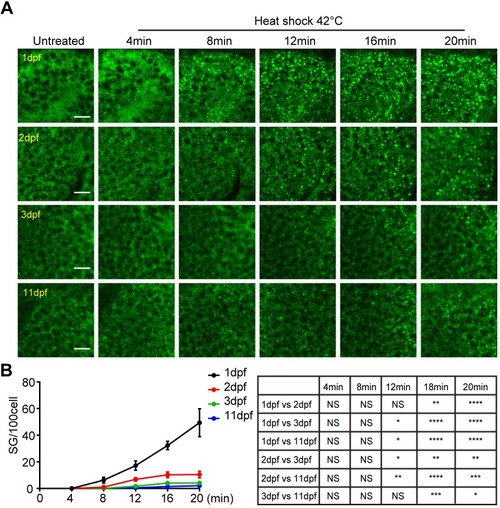
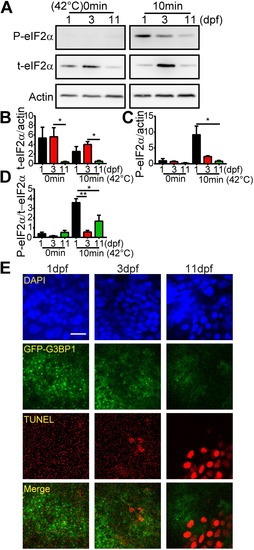
Heat resilience in embryonic zebrafish revealed by an in vivo stress granule reporter

Authors
Wang, R., Zhang, H., Du, J., Xu, J.
Source
Full text @ J. Cell Sci.

Establishment and characterization of GFP–G3BP1 knock-in zebrafish. (A) Schematic representation of the gene editing strategy used to insert GFP into the zebrafish g3bp1 locus. (B) Top, z-stacked picture showing the expression pattern of GFP–G3BP1 in 1 dpf embryo under basal conditions. Bottom, GFP reporter signal overlapped with bright-field image. Scale bars: 200 µm. (C) Stress granules in lens, retina and midbrain cells of 1 dpf GFP–G3BP1 knock-in zebrafish when exposed to 42°C for 0 or 10 min, and at 3 and 6 min after the removal of heat stress shock. Enlarged images of the areas in the midbrain region marked by yellow squares are shown in the lower panels. Scale bars: 10 µm.

The GFP–G3BP1 reporter responds to oxidative and ER stresses in embryonic zebrafish. (A) Single-layer image showing GFP–G3BP1 expression in 1 dpf zebrafish under basal conditions. This region is examined in more detail in panels B and C. (B) Induction of stress granules in the retina, but not in the brain, of 1 dpf GFP–G3BP1 knock-in zebrafish after 30 mM sodium arsenite (SA) exposure in the medium for the indicated amount of time. (C) Induction of stress granules in epidermal cells in 1 dpf zebrafish exposed to 20 mM dithiothreitol (DTT) stress for indicated amount of time. (D) Induction of stress granules in the epidermal cells in 1 dpf zebrafish exposed to 10 mg/ml puromycin (PM) stress for 5 h. (E) Stress granule formation in midbrain was suppressed by treatment with 10 mg/ml cycloheximide (CHX). Enlarged images of the yellow square areas in the midbrain region are shown in the lower panels. Images show representative results from 2–3 independent experiments each with n=3–4 zebrafish examined at each condition. Scale bars: 20 µm.

Stress granule formation varies in different brain regions. (A) Ten-minute heat shock-induced stress granules in the forebrain, midbrain and hindbrain region in 1 dpf GFP–G3BP1 knock-in zebrafish. The yellow boxed areas were enlarged and shown in the lower panels. Scale bars: 10 µm. (B) Quantification of stress granules (sized ≥0.1 µm) formed in cells from each region. Cells quantified were at the same depth (20 µm under the epidermis) in each region to minimize any potential difference due to heat conductance. Values represent mean±s.e.m., n=5 zebrafish, 100–120 cells per field. ****P≤0.0001 by unpaired Student's t-test. (C–E) Stress granule dynamics in heat-shocked cells from midbrain and hindbrain in 1 dpf GFP–G3BP1 knock-in zebrafish. After removal of heat shock, selected stress granules were analyzed using FRAP. All the stress granule-positive cells analyzed using FRAP were at the same depth (10 µm under epidermis). (C) Representative images of the stress granules before and after photobleaching at different times. Scale bar: 2 µm. (D) Signal intensity of GFP fluorescence from FRAP. The average fluorescence intensity before photobleaching was designated as 1. (E) Mobile fraction calculated from the FRAP analysis in D. Values in D,E represent mean±s.e.m. For each brain region, 14–15 cells from 5–6 zebrafish were analyzed. *P≤0.05, ***P≤0.001 by unpaired Student's t-test.

Heat pre-conditioning suppresses stress granule formation. (A) Representative images showing stress granule formation in midbrain and retina cells of 1 dpf GFP–G3BP1 knock-in zebrafish with indicated treatment paradigms. Control, fish kept at ambient temperature 28°C; 35°C 6 h, fish kept at 35°C for 6 h; 42°C 10 min, fish heat-shocked at 42°C for 10 min; 35°C for 6 h+42°C 10 min, fish first exposed to 35°C for 6 h, then heat-shocked for 10 min at 42°C. Scale bar: 10 µm. (B) Mean±s.e.m. percentage of zebrafish with stress granules detected in the midbrain. Data from two independent experiments, with n=10, 7, 19 and 17 fish for each condition. **P≤0.01 by unpaired Student's t-test.

Delayed stress granule formation in zebrafish larvae. (A) Representative images showing the formation of stress granules in the midbrain (optical tectum) at indicated time with heat shock at 42°C for GFP–G3BP1 knock-in fish at different ages during early development. Scale bars: 10 µm. (B) Quantification of the number of stress granules (sized ≥1 µm) at the same depth (20 µm under epidermis) in fish from 1 to 11 dpf as indicated. Values represent mean±s.e.m.; n=4 zebrafish for each age, with 100–300 cells scored for each fish. Statistical results analyzed by two-way ANOVA followed by multiple comparison are shown in the table to the right. *P≤0.05, **P≤0.01, ***P≤0.001, ****P≤0.0001.

Heat shock-induced cell death coincides with decreased level of p-eIF2α and reduced number of stress granules in fish larvae. (A) Representative western blots showing the expression of phosphorylated eIF2α (p-eIF2α), total eIF2α (t-eIF2α) and actin after 10 min heat shock in the brain of 1, 3 and 11 dpf GFP–G3BP1 knock-in zebrafish. (B–D) Quantification of the expression of t-eIF2α relative to actin (B), p-eIF2α relative to actin (C) and p-eIF2α relative to p-eIF2α (D). Values represent mean±s.e.m. Data from three independent experiments, with n=15–20 zebrafish brains pooled for protein analysis for each condition. *P≤0.05, **P≤0.01 by unpaired Student's t-test. (E) Representative images showing stress granule formation and cell death (revealed by TUNEL staining, red) in the epidermis of 1, 3 and 11 dpf GFP–G3BP1 knock-in zebrafish exposed to 42°C for 20 min. n=4–5 zebrafish at each age with similar results. Scale bar: 10 µm.

EXPRESSION / LABELING:
Gene:
Antibodies:
Fish:
Condition:
Anatomical Term:
Stage Range: Prim-5 to Days 7-13
Acknowledgments
This image is the copyrighted work of the attributed author or publisher, and ZFIN has permission only to display this image to its users. Additional permissions should be obtained from the applicable author or publisher of the image. Full text @ J. Cell Sci.