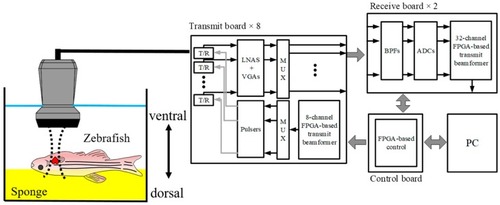
Experiment setup for adult zebrafish heart imaging. The zebrafish was anesthetized and placed on a sponge (yellow box) to position the ventral side facing upwards, and the ultrasound array transducer was positioned above.

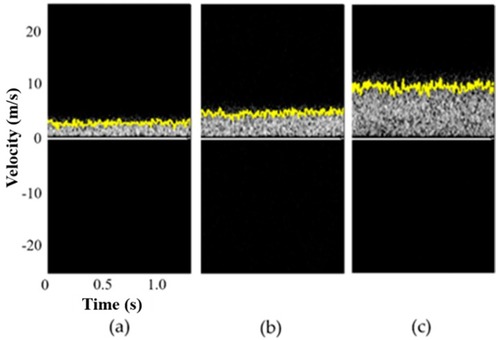
Measured flow velocities using pulsed wave spectral Doppler imaging acquired from the flow phantom with velocities of (a) 3, (b) 5, and (c) 10 cm/s. The measured average velocities for each case were, respectively, 2.9 ± 0.4, 4.9 ± 0.5, and 9.9 ± 0.7 cm/s.

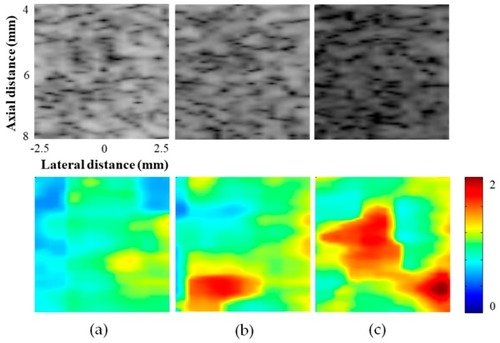
Ultrasound B-mode images and corresponding Nakagami images from the tissue-mimicking phantoms with different scatterer concentrations of (a) 3, (b) 6, and (c) 10 %. The phantoms with higher scatterer concentrations yielded higher Nakagami parameter values.

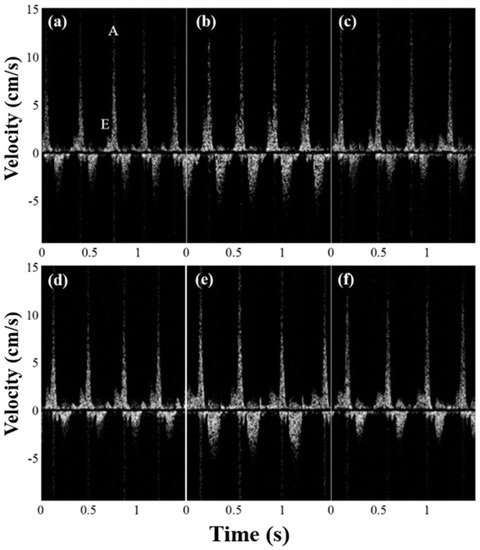
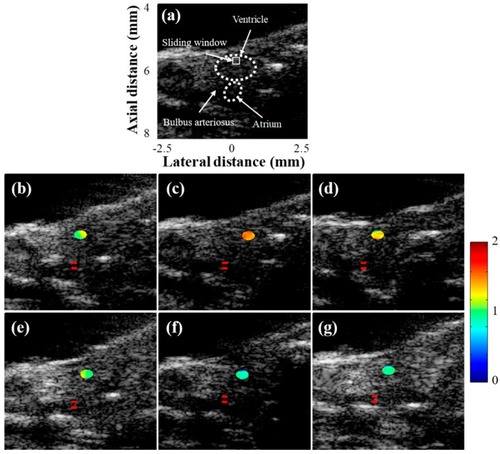
Spectral Doppler waveforms acquired from the adult zebrafish (
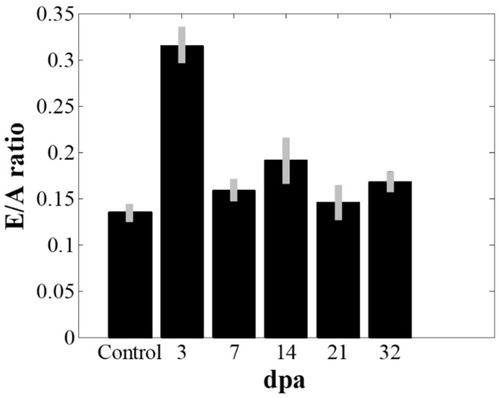
a) one week prior to ventricular amputation and (b) 3, (c) 7, (d) 14, (e) 21, and (f) 32 days post-amputation (dpa) to monitor functional changes of the heart during regeneration. Examples of an E-flow and A-flow are indicated in Figure 4a.

The changes of the E/A ratio values that represents the ratio of the peak velocity of blood flow in the early diastole (E-flow) to the peak velocity in the late diastole via atrial contraction (A-flow) before and after amputation. The E/A value increased at 3 dpa (p-value < 0.05) and recovered to the value before amputation. The error bars indicate the standard deviation in the data from five zebrafish.

(a) B-mode image acquired from the adult zebrafish and Nakagami images overlaid on B-mode images from the zebrafish (b) one week prior to ventricular amputation, (c) 3, (d) 7, (e) 14, (f) 21 and (g) 32 days post-amputation (dpa). The Nakagami image was only constructed at the amputated regions. The location of Doppler gates in each image are indicated with red lines.

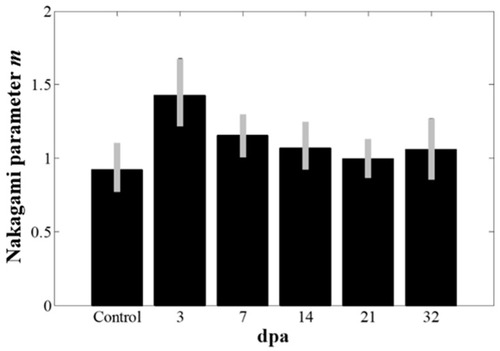
The changes of the Nakagami parameter m values before and after amputation. The Nakagami parameter value significantly increased at 3 dpa (p-value < 0.05) and recovered to the value before amputation. The error bars indicate the standard deviation in the data from five zebrafish.

Acknowledgments
This image is the copyrighted work of the attributed author or publisher, and ZFIN has permission only to display this image to its users. Additional permissions should be obtained from the applicable author or publisher of the image. Full text @ Sensors (Basel)