
- Title
-
Tuning Protein Diffusivity with Membrane Tethers
- Authors
- Mörsdorf, D., Müller, P.
- Source
- Full text @ Biochemistry
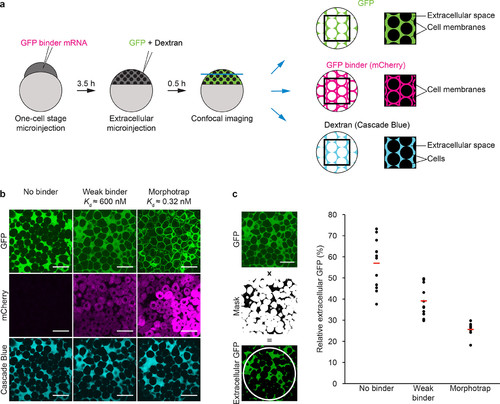
A low-affinity GFP binder partially tethers extracellular GFP to cell membranes in zebrafish embryos. (a) Schematic of the localization assay. GFP binders were expressed in zebrafish embryos by microinjecting 100 pg of the corresponding mRNAs at the one-cell stage. After 3.5 h of embryonic development, GFP and a fluorescent dextran were injected extracellularly followed by confocal microscopy to determine the localization of GFP, the GFP binder (mCherry), and dextran (Cascade Blue). The panel on the right illustrates the localization of the three fluorescent signals shown in panel b. (b) Without GFP binders, GFP is distributed homogeneously in the extracellular space. In embryos expressing the weak GFP binder, GFP can be detected both on cell membranes and in the extracellular space. In the presence of the morphotrap, the majority of GFP localizes to cell membranes. Scale bars correspond to 50 μm. (c) A mask was created from the extracellular dextran signal and used to extract the GFP signal in cell-free areas within a circular region of interest (ROI, white). The graph shows measurements of extracellular GFP normalized to total GFP in the ROI from single embryos (black dots). Red lines indicate mean values. The scale bar corresponds to 50 μm. |
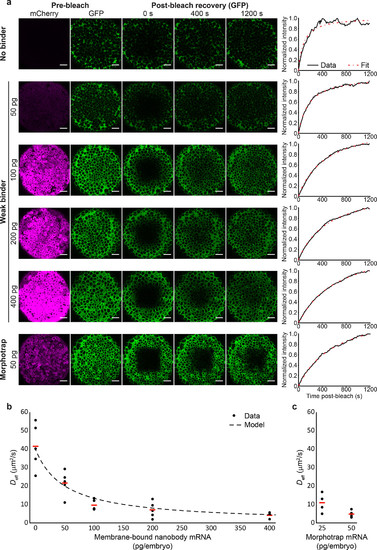
Titration of a low-affinity GFP binder modulates the mobility of extracellularly injected GFP in zebrafish embryos. (a) Different amounts of mRNA encoding the weak binder ( Kd = 600 nM in vitro) were injected into zebrafish embryos at the one-cell stage (50, 100, 200, or 400 pg); negative controls were left uninjected (0 pg of mRNA), and positive controls were injected with 50 pg of mRNA encoding the morphotrap ( Kd = 0.32 nM in vitro). Before the embryos were mounted for FRAP experiments at blastula stages, they were injected extracellularly with approximately 100 pg of recombinant GFP. FRAP experiments were performed as previously described(8,11) and analyzed using PyFRAP.(27) Scale bars correspond to 50 μm. (b and c) The effective diffusion coefficients ( Deff) of independent experiments executed as described for panel a are shown as black dots, and red lines indicate mean values. The dashed line in panel b shows an overlay with the effective diffusion model calculated from the equation in Figure 1d (see the Supporting Information for details). |