
- Title
-
Molecular codes and in vitro generation of hypocretin and melanin concentrating hormone neurons
- Authors
- Seifinejad, A., Li, S., Mikhail, C., Vassalli, A., Pradervand, S., Arribat, Y., Pezeshgi Modarres, H., Allen, B., John, R.M., Amati, F., Tafti, M.
- Source
- Full text @ Proc. Natl. Acad. Sci. USA

Knockdown of critical TFs identified for Hcrt and Pmch gene expression and sleep behavior in fish. (A, Left) Mortality and developmental defect rate of 48-h postfertiliation zebrafish larvae injected with 2.5 ng of candidate Mo (SI Appendix, Table S7). Data are presented as percentage of fish that exhibit the phenotype (10 < n < 20). (Right) Visualization of HCRT signal in brain hemispheres of zebrafish embryos by immunostaining and confocal microscopy. The percentage of brain hemispheres positive or negative for HCRT signal for each candidate Mo is presented. (B) Representative image of loss of HCRT signal in Mo-Zfp271-injected zebrafish brains compared with controls. (10× confocal magnification.) (C) Hourly distribution of locomotor activity of Zfp271 morphants and their respective controls during 48 h (night [10 h] and day [14 h]). Dark periods are indicated in gray and light periods in white. As shown in the bar graph (Right) Mo-Zfp271-injected zebrafish exhibit about 50% reduced locomotor activity during the light period. **P < 0.01; ***P < 0.001. (D) Hourly distribution of sleep during 48 h. Mo-Zfp271-injected zebrafish exhibit profound increase in sleep time compared with controls. (E) Sleep bout numbers and bout durations in Mo-Zfp271-injected fish compared with controls. During both light and dark periods, Zfp271 morphants exhibit reduced bout number. *P < 0.05; ***P < 0.001; n = 48, mean ± SEM, t test. (F) HCRT and MCH neuron counts in Peg3hemizygous KO mice (Hz; Peg3+/−) and their WT littermates. The entire hypothalamus was covered from anterior to posterior regions and all sections were counted. *P = 0.04 for HCRT and *P = 0.02 for MCH; total cell number ± SEM, Mann–Whitney U test; n = 5 to 6. (G) Quantitative PCR of brain Hcrt, Pmch, and Peg3 expression during different time points. There is a parallel increase in the expression of Hcrt and Pmch along with Peg3 up to 3 wk after birth. *P = 0.019 for Peg3 and P = 0.03 for Pmch; **P < 0.01; n = 3, mean ± SEM; t test. (H) Potential gene network for identified TFs within HCRT cells. Their interactions are extracted from databases. The more effective TFs in zebrafish study (green) have bigger sizes. Identified TFs but not tested are in brown and potential targets in red. EXPRESSION / LABELING:
|
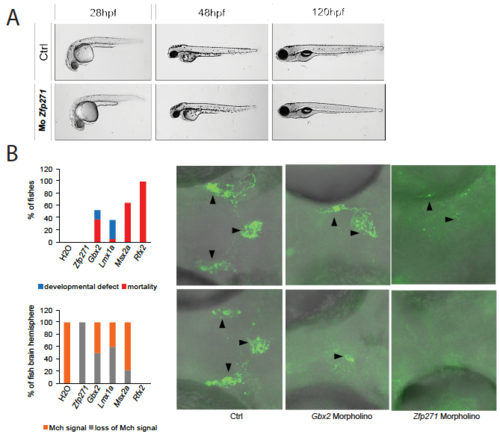
Morpholino knock-down of candidate TFs identified the effective ones for Pmch gene expression. (A) Zfp271 morpholino did not induce any developmental defect. (B) Mortality and developmental defect rate (left up), Loss of MCH signal and its positive signal after immunostaining (left bottom). Representative image of loss of HCRT signal in Zfp271 morpholino-injected zebrafish brains compared to controls (right). EXPRESSION / LABELING:
PHENOTYPE:
|