
- Title
-
Genomic non-redundancy of the mir-183/96/182 cluster and its requirement for hair cell maintenance
- Authors
- Fogerty, J., Stepanyan, R., Cianciolo, L.T., Tooke, B.P., Perkins, B.D.
- Source
- Full text @ Sci. Rep.
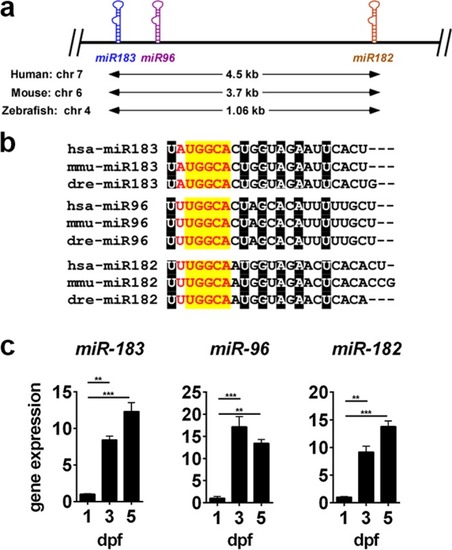
Primary sequence overlap, conservation, and expression of the mir-183/96/182 cluster. (a) Schematic diagram illustrating genomic structure of the mir-183/96/182 cluster. (b) Primary sequence of each miRNA in human, mouse, and zebrafish. The minimal seed sequence is displayed in red text. Nucleotides within the seed region with 100% conservation between component miRNAs and across species are highlighted in yellow. Nucleotides highlighted in black are similarly conserved, but are outside the seed sequence. (c) miRNA expression in zebrafish head tissue during early development was measured by qPCR. For all data points, n = 3. **p < 0.01, ***p < 0.001, ANOVA with Dunnet’s multiple comparisons test, relative to 1dpf. |
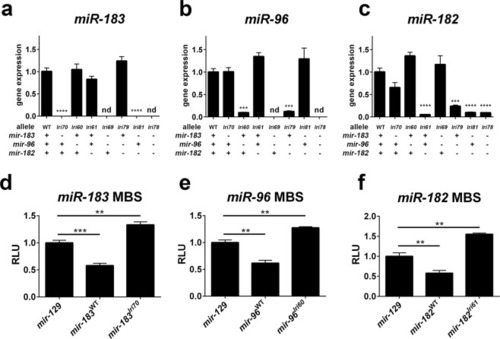
Expression and activity of mutant miRNAs. (a–c) Wild-type and mutant miRNAs were detected in adult zebrafish retina by qPCR. Mutant animals were all homozygotes. Asterisks indicate significantly decreased expression, relative to WT. nd = not detected. (d–f) miRNAs were cloned from adult mutant and wildtype genomic DNA and co-transfected with luciferase reporters encoding miRNA binding sites (MBS) for the indicated miRNAs. Decreased reporter signal indicates miRNA activity, relative to the miR-129 control miRNA. RLU = relative light units. **p < 0.01, ***p < 0.001, ****p < 0.0001, ANOVA with Dunnet’s multiple comparisons test. For all data points, n = 3. |
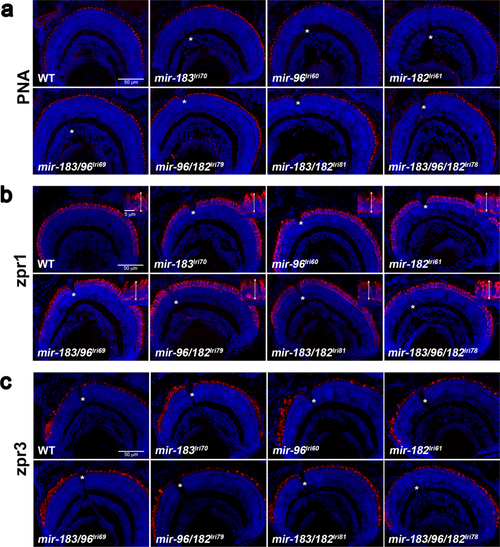
Survey of retinal anatomy in 5dpf mutant larvae. Transverse sections were collected near the optic nerve, which is visible in some images (asterisks), and stained with markers for different photoreceptor cell types. In all images, the ventral retina is to the left. (a) Peanut agglutinin lectin (PNA) labels the extracellular matrix surrounding cone outer segments. (b) zpr1 labels red/green cone inner segments. Inserts show higher magnification images, with double arrows indicating how inner segments were measured. (c) zpr3 labels rod outer segments, which are immature at this age and typically longer and more numerous in the ventral retina.
|
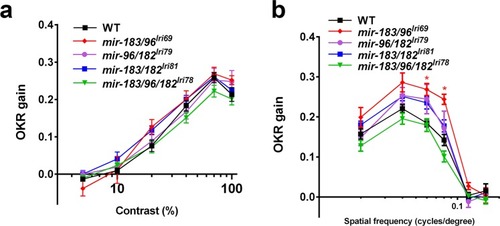
Mutant larvae have normal visual function. The optokinetic response (OKR) in 5 dpf larvae was measured while varying both (a) contrast and (b) spatial frequency of the stimulus. Asterisks in (b) indicate where a slightly improved OKR was measured in mir-183/96lri69 mutants. *p < 0.05, ANOVA with Dunnet’s multiple comparisons test. |

Adult mutants have normal retinal structure, but mir-183/96/182lri78 survival is depressed. (a,b) Survey of retinal anatomy in adult fish at (a) 12 m or (b) 6 m. Markers used here are equivalent to those used for imaging of larval fish, except that we also examined PCNA and Gfap staining to look for evidence of cell proliferation and gliosis, respectively. (c) Quantification of PCNA labeling in double mutants. PCNA + cells were counted across a 10μm thick retinal cross-section at the level of the optic nerve. Proliferating cells in the optic nerve head and in the ciliary marginal zone were excluded. ns = not significant (ANOVA). For all data points, n = 3. (d) Survival curve of fish from incrosses of WT and mir-183/96/182lri78 heterozygous parents. Each of the two cohorts began the study with a population of 51 fry. (e) Histological analysis of a surviving 15wk mir-183/96/182lri78 homozygote, showing normal retinal anatomy. Arrows in (a), (b), and (e) denote PCNA+ nuclei.
EXPRESSION / LABELING:
PHENOTYPE:
|
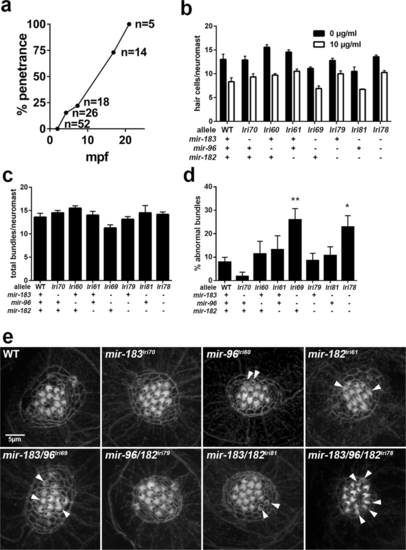
Abnormal hair cells in mir-183/96lri69 and mir-183/96/182lri78 mutants. (a) Penetrance of abnormal swimming phenotype in mir-183/96lri69 mutants in a cross-sectional survey of fish in our colony at the time of manuscript preparation. mpf = months post fertilization. (b) Acute toxicity of gentamicin on lateral line neuromast hair cells, as determined by HCS-1 immunolabeling. Differences among genotypes within each treatment group are not statistically significant compared to WT controls (ANOVA with Dunnet’s multiple comparisons test). Each data point is the average of 3–5 fish. (c) Counts of the total number of stereociliary bundles per neuromast. There are no statistically significant differences (ANOVA with Dunnet’s multiple comparisons test). (d) The fraction of neuromast hair cells with abnormal sterociliary bundles (*p < 0.05, **p < 0.01, ANOVA with Dunnet’s multiple comparisons test). For (d-e), sample sizes are: WT, 14; lri70, 4; lri60, 4; lri61, 4; lri69, 8; lri79, 8; lri81, 4; lri78, 13. (e) Representative images of neuromast stereociliary bundles, stained with phalloidin. Arrows indicate small or disorganized bundles that we scored as abnormal.
|
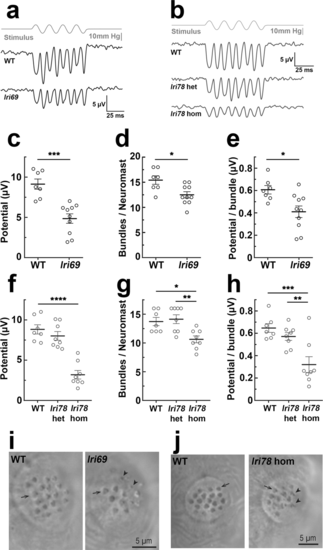
Microphonic potentials of mir-183/96lri69 and mir-183/96/182lri78 fish are reduced. (a,b) Representative microphonic potentials obtained from lateral line neuromasts of mir-183/96lri69 (a) and mir-183/96/182lri78 (b) fish. The top trace in each panel shows pressure applied to a stimulating puff pipette. Traces of microphonic potential recordings from neuromasts are shown below. (c) Summary of microphonic potentials from mir-183/96lri69 fish. Each point represents the average of maximal peak to peak amplitudes of responses produced from anterior and posterior deflections of the cupula. (d) Number of hair cells per neuromast in mir-183/96lri69 fish that were observable with brightfield imaging during recording. (e) Microphonic potentials from mir-183/96lri69 fish, normalized to the number of observable bundles in the neuromast. (f) Summary of microphonic potentials from mir-183/96/182lri78 fish. (g) Number of hair cells per neuromast in mir-183/96/182lri78 fish. (h) Microphonic potentials from mir-183/96/182lri78 fish, normalized to the number of observable bundles in the neuromast. (I,j) Representative neuromasts of mir-183/96lri69 (i) and mir-183/96/182lri78 (j) fish, imaged during recording. Arrows indicate normal stereocilia bundles, arrowheads indicate small and disorganized bundles. c-e, Student’s t-test; f-h, ANOVA with Tukey’s multiple comparisons test. *p < 0.05, **p < 0.01, ***p < 0.001, ****p < 0.0001. |