
- Title
-
Augmentation of spinal cord glutamatergic synaptic currents in zebrafish primary motoneurons expressing mutant human TARDBP (TDP-43)
- Authors
- Petel Légaré, V., Harji, Z.A., Rampal, C.J., Allard-Chamard, X., Rodríguez, E.C., Armstrong, G.A.B.
- Source
- Full text @ Sci. Rep.
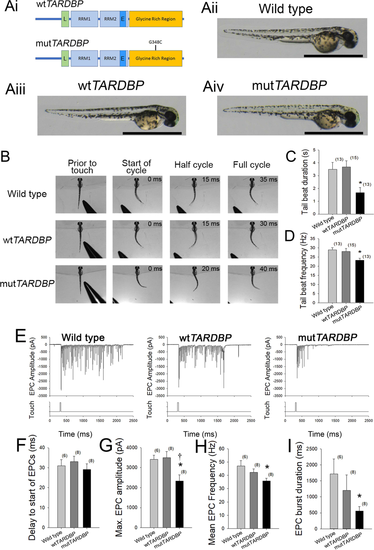
Expression of mutTARDBP results in touch-evoked defects in locomotor pattern generation. (Ai), Schematic representation of human wild type TARDBP and mutant TARDBP encoding the ALS-causing missense mutation G348C situated in the C-terminal glycine rich region. Other general structures of TARDBP include an N-terminal nuclear localization motif (L), RNA binding domains (RRM1 and RRM2) and a proposed nuclear export motif (E). (Aii–Aiv), Representative images of 52–54 hpf zebrafish larvae. Scale bar represents 1 mm. (B) Example still frames from high speed video recordings of touch-evoked locomotor tail-beat patterns in zebrafish larvae. Tail-beat patterns were found to be reduced in tail beat duration (C) and mean frequency (D) when compared to either wild type zebrafish or zebrafish larvae expressing wtTARDBP. Defects in pattern generation were observed in the synaptic inputs to muscle cells of the trunk during fictive locomotor patterns. (E) Example traces of whole-cell patch clamp recordings of rhythmic fast-twitch EPCs evoked by a light touch to the tail. No differences were found between the tail touch and the start of the EPCs (F), but the maximum EPC amplitude (G), mean EPC frequency (H) as well as the EPC burst duration (I) were all found to be reduced in larvae expressing mutTARDBP. Numbers in parentheses represent sample sizes. Asterisks and daggers represent statistical differences from wild type (p < 0.05) and wtTARDBP (p < 0.05) larvae respectively.
|
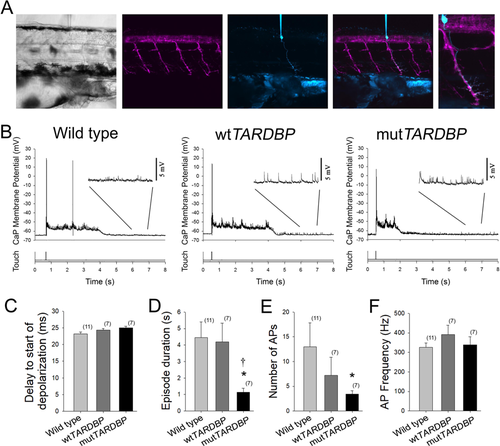
Attenuation of fictive synaptic depolarizations to spinal primary motoneurons during touch-evoked locomotor activity in larvae expressing mutTARDBP. (A) From left to right: a bright field image of a 54 hpf zebrafish trunk in a transgenic larvae expressing GFP (magenta) under the control of the motoneuron specific promotor Hb9, with a patch electrode dialyzing a CaP motoneuron with sulforhodamine (cyan). Fictive motor patterns were elicited with a light puff of water onto the tail using a picospritzer. (B) Example traces of CaP motoneuron synaptic depolarizations following light touch. Note the presence of increased spontaneous EPSPs following touch-evoked motor-related depolarizations (insets). (C) No differences were found in the delay between the touch and start of depolarizations among wild type larvae, larvae expressing wtTARDBP or larvae expressing mutTARDBP. However, both the duration of synaptic depolarizations (D) and the number of APs (E) elicited following light touch in larvae expressing mutTARDBP were found to be reduced when compared to either wild type larvae or larvae expressing wtTARDBP. Though fewer APs were generated in larvae expressing mutTARDBP, the frequency of APs (F) was not found to be different from wild type larvae or wtTARDBP larvae. Numbers in parentheses represent sample sizes. Asterisks and daggers represent statistical differences from wild type (p < 0.05) and wtTARDBP (p < 0.05) larvae respectively.
|
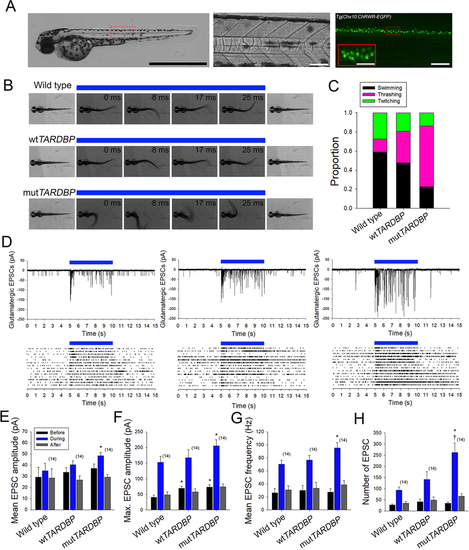
Augmentation of descending excitatory glutamatergic synaptic inputs to primary motoneurons expressing mutTARDBP. (A) Example bright field of image of a 56 hpf transgenic Chx10:ChRWF-EGFP zebrafish larva (left, scale bar represents 1 mm). Bright field image showing a section of the zebrafish trunk showing 6 somites (middle, scale bar represents 50 μm) with corresponding EGFP fluorescence image depicting spinal V2a interneurons expressing Chx10:ChRWF-EGFP (right, scale bar represents 50 μm and in inset 25 μm). (B) Example still frames from high speed video recordings of optogenetic stimulation of locomotor tail-beat patterns in zebrafish larvae partially embedded in agarose. (C) Proportion of larvae exhibiting different patterns of optogenetic-evoked activity, with the majority of larvae expressing mutTARDBP displaying tail thrashing. Sample sizes for optogenetically-evoked patterns of activity for wild type, wtTARDBP and mutTARDBP larval groups were 17, 21, and 22 respectively. (D) Example whole-cell voltage clamp recordings of optogenetically-evoked synaptic currents in CaP motoneurons (above) and EPSC raster plots from individual larvae (below). Recorded EPSC were binned into three groups, representing: 5 seconds before optogenetic stimulation, 5 seconds during light exposure, and the following 5 seconds after stimulation. Both the mean (E) and maximum amplitudes (F) of EPSCs recorded in CaP motoneurons in larvae expressing mutTARDBP were found to be higher than EPSCs recorded in wild type CaP motoneurons. Furthermore, the mean frequency of optogenetically driven EPSCs was found to be higher in larvae expressing mutTARDBP when compared to wild type EPSCs in CaP motoneurons (G). When the total number of evoked EPSCs was examined over the 5 second stimulus, larvae expressing mutTARDBP were found to generate more EPSCs than both wild type and wtTARDBP expressing larvae (H). Asterisks and daggers represent statistical differences from wild type (p < 0.05) and wtTARDBP (p < 0.05) larvae respectively.
EXPRESSION / LABELING:
|