FIGURE SUMMARY
Title

miR-221-5p regulates proliferation and migration in human prostate cancer cells and reduces tumor growth in vivo

Authors
Kiener, M., Chen, L., Krebs, M., Grosjean, J., Klima, I., Kalogirou, C., Riedmiller, H., Kneitz, B., Thalmann, G.N., Snaar-Jagalska, E., Spahn, M., Kruithof-de Julio, M., Zoni, E.
Source
Full text @ BMC Cancer

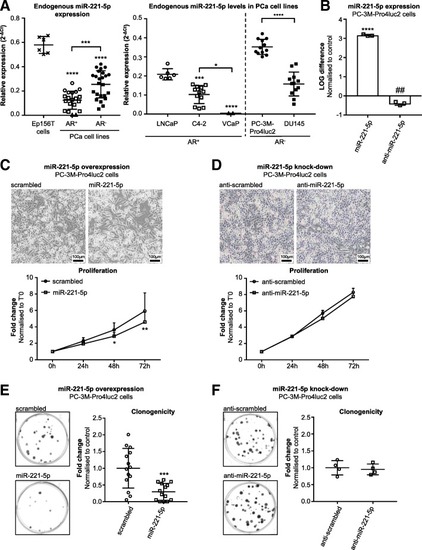
miR-221-5p exerts tumor suppressive function on PCa cell lines in vitro. aLeft: Relative miR-221-5p expression (2-ΔCt) in normal prostatic epithelial Ep156T cells and AR+ and AR PCa cell lines. Analysis by one-way ANOVA with Tukey’s multiple comparisons test. Right: Technical replicates of at least two independent experiments for each cell line. miR-221-5p expression of AR+ cells was analysed by one-way ANOVA with Tukey’s multiple comparisons test. AR cell lines were compared by unpaired, two-tailed t-test. * p < 0.05, *** p < 0.001, **** p < 0.0001. Figure symbols: cross: Ep156T; circle: LNCaP; square: C4–2; triangle: VCaP; filled circle: PC-3M-Pro4luc2; filled square: DU145 cells. b miR-221-5p expression levels in PC-3M-Pro4luc2 cells upon overexpression or knock-down of miR-221-5p. LOG difference to control was calculated as LOG(2-ΔΔCt) and analysed by unpaired, two-tailed t-test. Three technical replicates of representative experiments are shown. **** p < 0.0001 vs. scrambled, ## p < 0.01 vs. anti-scrambled. c Effect of miR-221-5p on proliferation. Images were taken 72 h post transfection with miR-221-5p and scrambled. MTS assay at 0 h, 24 h, 48 h, 72 h. Fold change compared to time point T’0 h was calculated for each time point. Data of n = 4 independent experiments are shown and were analysed by two-way ANOVA repeated measures by both factors with Sidak’s multiple comparison test. * p < 0.05, ** p < 0.01. d Effect of anti-miR-221-5p on proliferation. Images were taken at 72 h post transfection. MTS assay at 0 h, 24 h, 48 h, 72 h. Fold change compared to time point T’0 h was calculated for each time point. Data represent n = 5 technical replicates and were analysed by two-way ANOVA repeated measures with Sidak’s multiple comparison test. e Clonogenicity assay in miR-221-5p overexpressing PC-3M-Pro4luc2 cells. Dots indicate technical replicates of n = 4 independent experiments. Fold change was calculated vs. scrambled control and analysed by unpaired, two-tailed t-test. *** p < 0.001. f Clonogenicity assay in miR-221-5p knocked-down PC-3M-Pro4luc2 cells. N = 4 technical replicates are shown as fold change to control and analysed by unpaired, two-tailed t-test

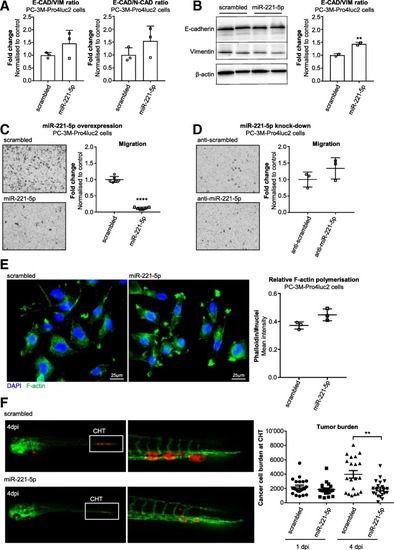
Overexpression of miR-221-5p affects plasticity of PCa cells and reduces extravasation in vivo.a E-CAD/N-CAD and E-CAD/VIM ratios were calculated from the relative mRNA expression and data of n = 3 independent experiments are shown as fold change to control. Data were analysed by paired, two-tailed t-test. b Expression of E-CAD and VIM protein in PC-3M-Pro4luc2 cells 72 h post transfection with miR-221-5p and scrambled. Bands were quantified and E-CAD/VIM ratio was calculated (normalised to β-actin). The data of n = 2 independent experiments are shown as fold change to scrambled and were analysed by paired, two-tailed t-test. ** p < 0.01. c Migration of miR-221-5p overexpressing PC-3M-Pro4luc2 cells. Dots represent technical replicates of n = 3 independent experiments. Data are shown as fold change to scrambled and were analysed by unpaired, two-tailed t-test. **** p < 0.0001. d Migration of PC-3M-Pro4luc2 cells with miR-221-5p knock-down. N = 3 technical replicates are shown. Data were normalised to control and analysed by unpaired, two-tailed t-test. e Phalloidin staining in PC-3M-Pro4luc2 cells overexpressing miR-221-5p or scrambled control. F-actin signal was normalised to number of nuclei. Data was analysed by unpaired, two-tailed t-test. F-actin = green; DAPI = blue. f Extravasation of miR-221-5p and scrambled transfected PC-3M-pro4_mCherry cells at the caudal hematopoietic tissue (CHT) of zebrafish embryos 4 days post injection (dpi). Tumor burden was quantified 1dpi and 4dpi. Green = vessels; red = PC-3M-pro4_mCherry cells. Data was analysed by unpaired, two-tailed t-test. ** p < 0.01

Acknowledgments
This image is the copyrighted work of the attributed author or publisher, and ZFIN has permission only to display this image to its users. Additional permissions should be obtained from the applicable author or publisher of the image. Full text @ BMC Cancer