
- Title
-
All-optical imaging and manipulation of whole-brain neuronal activities in behaving larval zebrafish
- Authors
- Jiao, Z.F., Shang, C.F., Wang, Y.F., Yang, Z., Yang, C., Li, F.N., Xie, J.Z., Pan, J.W., Fu, L., Du, J.L.
- Source
- Full text @ Biomed. Opt. Express

Simultaneous whole-brain imaging and targeted manipulation of neuronal activity of behaving larval zebrafish. (a) Schematic diagram of setup. Patterned photo-stimulation was incorporated into a light-sheet microscope through the imaging light path, and a near-infrared light path was used for behavior monitoring. (bottom left) GCaMP6f, ChrimsonR, and filter combination spectra. The separated GCaMP6f and ChrimsonR spectra allowed simultaneous light-sheet imaging and photo-stimulation without spectral bleeding. ChrimsonR Ex: ChrimsonR excitation spectrum; GCaMP6f Ex and Em: GCaMP6f excitation and fluorescence emission spectra, respectively. Blue and yellow dashed lines: GCaMP6f (488 nm) and ChrimsonR (589 nm) excitation wavelengths, respectively. (b) Simultaneous targeted manipulation and whole-brain imaging of neuronal activity (top) and behavior monitoring (bottom). Distributed neurons were targeted with photo-stimulation (red dots) during whole-brain neuronal activity imaging and fish behavior monitoring. (DMD: digital micromirror device; L1−L4: lenses 1−4; OD: optical diffuser; (s)CMOS: (scientific) complementary metal-oxide semiconductor; F1, F2: green and red band-pass filters, respectively; F3: infrared long-pass filter; DM: multi-band dichroic mirror; TL1, TL2: tube lenses 1 and 2; Obj3, Obj4: fluorescence detection and behavior monitoring objectives, respectively; M, reflective mirror.) |

Pipeline for photo-stimulation of targeted neurons. From the captured fluorescence image of the brain of a 5-dpf zebrafish larva pan-neuronally expressing ChrimsonR-tdTomato (a), we arbitrarily selected single neurons (red circles in (b)) as photo-stimulation targets. Based on these neurons' positions and soma sizes, we calculated the photo-stimulation pattern and loaded it onto the DMD (c) to activate the target-corresponding micromirrors. Upon this targeted photo-stimulation, tdTomato fluorescence was imaged from the same field of view as for (a), and fluorescence was observed on the target neurons. (a and d, bottom) Enlarged view of region of interest (white dashed square) in each panel. |
<p>Pipeline for photo-stimulation of targeted neurons. From the captured fluorescence image of the brain of a 5-dpf zebrafish larva pan-neuronally expressing <em>ChrimsonR-tdTomato</em> (a), we arbitrarily selected single neurons (red circles in (b)) as photo-stimulation targets. Based on these neurons' positions and soma sizes, we calculated the photo-stimulation pattern and loaded it onto the DMD (c) to activate the target-corresponding micromirrors. Upon this targeted photo-stimulation, tdTomato fluorescence was imaged from the same field of view as for (a), and fluorescence was observed on the target neurons. (a and d, bottom) Enlarged view of region of interest (white dashed square) in each panel.</p> |

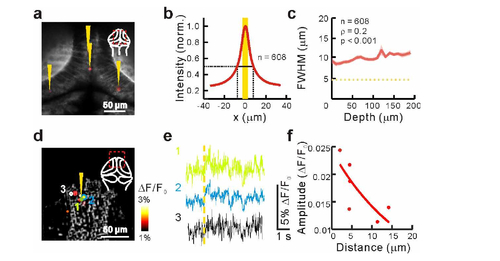
Targeted photo-stimulation of habenulae evokes synaptic transmission. (a) Postsynaptic responses evoked by targeted photo-stimulation. Nine neurons (green) in the left dorsal habenula (Hb-l) and activated neurons (color dots) in bilateral Hb (55 Hb-l and 11 Hb-r (the right dorsal habenula)) in a 6-dpf Tg(elavl3:H2B-GCaMP6f;elavl3:ChrimsonR-tdTomato) larva were targeted for photo-stimulation. The neuronal activities were measured based on the amplitude of the GCaMP6f fluorescence change (ΔF/F0) and superimposed on reference anatomy (grey) in dorsal (x-y), sagittal (y-z) and coronal (x-z) projections. (b) Representative neuronal responses evoked by targeted photo-stimulation before (left) and after (right) blockade of glutamatergic transmission through bath application of CNQX (50 μM) and APV (50 μM). The green traces indicate the response of a targeted neuron in Hb-l, and the blue traces display the postsynaptic responses of three activated neurons in Hb-r. The yellow arrows indicate the targeted photo-stimulation events. |

Targeted photo-stimulation of tegmentum activates brain-wide functional connections. Representative images (a) and traces (b) showing activation of brain-wide downstream neurons evoked by targeted photo-stimulation. The left dorsal tegmentum (Teg-l, green area) in a 6-dpf Tg(elavl3:H2B-GCaMP6f;elavl3:ChrimsonR-tdTomato) larva was targeted for photo-stimulation, which activated widely distributed neurons in brain regions including Teg-l, Pa-l, Pa-r, Hb-l, Hb-r, Th-l, Th-r, OT-l, OT-r, Cb-l, and Hind-l (Pa: bilateral pallium; Th: thalmus; CB: cerebellum; Hind: hindbrain). The stimulation pattern designed based on the anatomical position of Teg-l on each depth. (b, right) Average responses expanded in time. The yellow arrows (b, left) and shaded area (b, right) indicate the targeted photo-stimulation events. The activities of the representative Th-l, Th-r, and Cb-l neurons were not recorded during the stimulation with the current experiment paradigm. (c) Activated neuron distribution (left) and differences in optogenetic response amplitude (middle) and latency (right) among regions across the whole brain. Neurons showing significant responses to three or four of four photo-stimulation repetitions were considered reliably responsive and included in the distribution. Box-and-whisker plots of the amplitude and latency represent the 25th, 50th, and 75th quartiles (box lines) and the extreme values (by whiskers). (d) Schematic showing brain-wide functional neural networks downstream of Teg-l. The red arrows represent the functional connections between Teg-l and the indicated brain areas. |
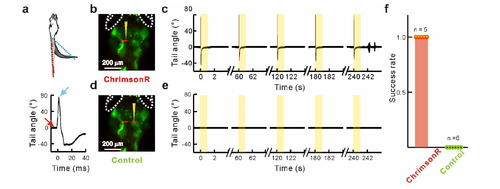
Targeted photo-stimulation of Mauthner cells evokes tail curling in larval zebrafish. (a) Tail movement of head-restrained larval zebrafish measured in terms of angle between current tail direction (blue) and resting tail position (red). (b, c) Example showing that targeted photo-stimulation (b, yellow triangle) of ChrimsonR-expressing Mauthner cell (b, red) reliably evoked tail curling in five consecutive trials (c). White dashed lines in (b): eye outlines; yellow shaded areas in (c), photo-stimulation periods. (d, e) Example showing that targeted photo-stimulation (d, yellow triangle) of contralateral Mauthner cell (d, red dash circle) with expression of GFP but not ChrimsonR could not evoke tail movement (e). The data shown in (b)−(e) were obtained from the same larva. (f) Success rates of tail movements evoked by targeted photo-stimulation of unilateral Mauthner cells with (red) and without (green) ChrimsonR expression. The numbers indicate the number of examined cells. |