
- Title
-
Excessive inflammation impairs heart regeneration in zebrafish breakdance mutant after cryoinjury
- Authors
- Xu, S., Liu, C., Xie, F., Tian, L., Manno, S.H., Manno, F.A.M., Fallah, S., Pelster, B., Tse, G., Cheng, S.H.
- Source
- Full text @ Fish Shellfish Immunol.
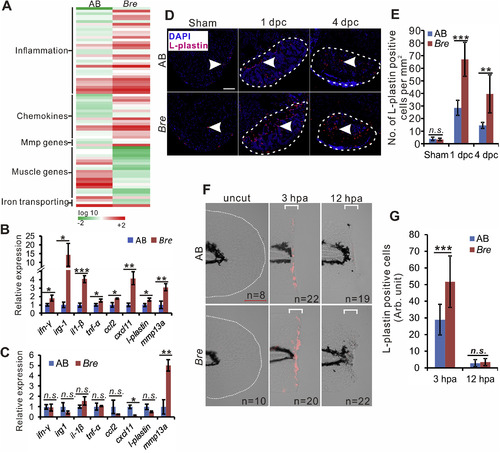
Excessive inflammation is induced in the injured tissue of bre mutant zebrafish. (A). Heat map shows transcriptome analysis of AB and bre mutant heart at 4 dpc, n = 3. (B, C). The qRT-PCR analysis of gene expression in the heart of AB and bre mutant zebrafish at 4 dpc (B), and untreated heart (C). The asterisk indicates significant difference observed at p < 0.05 (*) and p < 0.01 (**) between AB and bre mutant zebrafish, while the ‘n.s’ indicates no significant difference, n = 3, two tail t-test. (D). Representative heart sections of sham-operated, 1 dpc and 4 dpc AB wild-type and bre mutant zebrafish showing L-plastin positive cells (red, white arrowhead) in the injured area (bounded by a white dashed line). Scale bar: 100 μm. (E). Bar chart shows the quantification of L-plastin positive cells (n = 4–6) in panel (C) was significantly different at p < 0.01 (**) and p < 0.001 (***), two tail t-test. (F). Representative images displaying L-plastin positive cells (red) in the fin of bre mutant larvae. The white dash line in the panel indicates the shape of the uncut fin. Scale bar: 200 μm. (G). Bar chart shows the quantification of L-plastin positive cells in panel E was significantly different at p < 0.001 (***), two tail t-test. |

Comparative analysis of cardiac regenerative ability in AB and bremutant zebrafish after heart cryoinjury. (A). Representative TUNEL staining sections of AB and bre mutant zebrafish indicating the apoptotic cells (red, white arrow) in the injured area (bounded by the white dashed line) of the heart at 1 dpc and 4 dpc, and whole ventricle of sham-operated zebrafish. Scale bar: 100 μm. (B). Bar chart shows the quantification of apoptotic cells (n = 3–6) in panel (A) was significantly different at p < 0.05 (*), two tail t-test. (C) qRT-PCRanalysis expression levels of apoptotic cytokine in AB and bre mutant heart at 4 dpc. The asterisk indicates significant difference observed at p < 0.05 (*) and p < 0.01 (**) between AB and bre mutant zebrafish, n = 3, two tail t-test. (D-G) Representative picrosirus red staining paraffin sections of AB and bre mutant zebrafish heart displaying scar volume (D) and thickness of compact layer (F) at 30 dpc. The black dashed line indicates the injured scar area. Black arrowhead(F) indicates the fibrotic subepicardial layer in bre mutant zebrafish. Scale bar: 100 μm. Bar chart (E, G) shows the quantification of the percentage of scar volume in panel D and thickness of the epicardial layer in panel F was significantly different between AB and bre mutant at p < 0.05 (*) (n = 5), two tail t-test. (H) Representative images of immunofluorescent labeling of cardiomyocyte (red) and PCNA (green) in the injured area of AB and bre mutant zebrafish at 7 dpc. White arrow indicates the double positive TnnT+/PCNA+cells in the injured area (IA). Scale bar: 100 μm. (I). Bar chart shows the quantification of double positive TnnT+/PCNA+ (n = 4) in panel H, two tail t-test, p < 0.05 (*). (J). Representative images of immunofluorescent labeling of mitotic cells (green, green arrowhead) in the injured area of AB and bre mutant zebrafish at 7 dpc. Scale bar: 100 μm. (K). Bar chart shows the quantification of mitotic cells (n = 4) in panel J, two tail t-test, p < 0.05 (*). (L). Representative images of immunofluorescent labelling of α-SMA (green, white arrowhead) in the heart of AB (n = 4) and bre mutant (n = 4) zebrafish. |
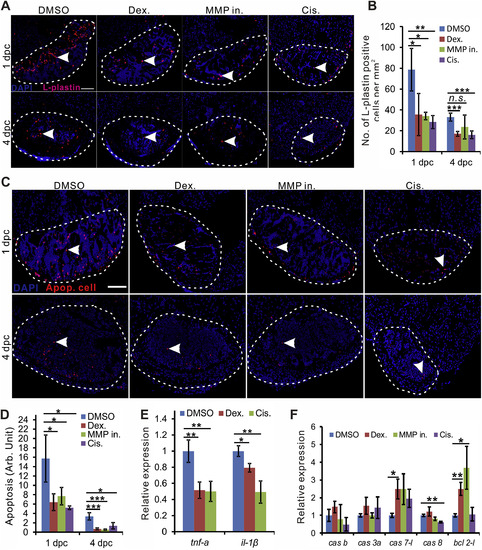
Anti-inflammatory reagents and cisapride reduce leukocyte and apoptotic cells in the heart of bre mutant zebrafish. (A). Representative heart sections of DMSO, Dex (100 μm), MMP in (1 μm) and Cis (10 μm)-treated bremutant zebrafish at 1 dpc and 4 dpc showing the L-plastin positive cells (red, white arrowhead) in the injured heart area (bounded by white dashed line). Scale bar: 100 μm. (B). Bar chart shows the quantification of L-plastin positive cells (n = 3–5) in panel A was significantly different at p < 0.05 (*), p < 0.01 (**) and p < 0.001 (***), one-way ANOVA. (C). Anti-inflammatory reagents and cisapride reduce apoptosis in bre mutant heart after injury. Representative heart sections of DMSO, Dex (100 μm), MMP in (1 μm) and Cis (10 μm) treated bremutant at 1 dpc and 4 dpc show the apoptotic cells (red, white arrowhead) in the injured area. Scale bar: 100 μm. (D). Bar chart shows the quantification of apoptotic cells (n = 3–5) in panel C was significantly different at p < 0.05 (*) and p < 0.001 (***), one-way ANOVA. (E, F). qRT-PCR analysis shows the expression of inflammatory genes (E) and apoptotic/anti-apoptotic genes (F) in bre mutant at 4 dpc with different anti-inflammatory reagents and cisapride regimens. Asterisks indicate a significant difference observed between DMSO control and Dex (100 μm), MMP in (1 μm) or Cis (10 μm) treatment at p < 0.05 (*) and p < 0.01 (**), one-way ANOVA. |

Anti-inflammation reagents and cisapride rescue the heart regenerative capability in bre mutant after cryoinjury. (A). Representative picrosirus red staining paraffin sections of heart in bre mutant treated with DMSO (vehicle control), Dex (100 μm), MMP in (1 μm) and Cis (10 μm) illustrate the scar volume at 30 dpc. The black dashed line bounded area indicates the injured scar area. Scale bar: 100 μm. (B). Bar chart (n = 4) shows the quantification of the percentage of scar volume in panel A was significantly different between control and each treatment group at p < 0.01 (**) and p < 0.001 (***), two tail t-test. (C) Representative images of immunofluorescent labeling of cardiomyocyte (red) and PCNA (green) in the injured area of bre mutant zebrafish treated with DMSO (vehicle control), Dex (100 μm), MMP in (1 μm) and Cis(10 μm) at 7 dpc. The white arrow indicates the double positive TnnT+/PCNA+ cells in the injured area (IA). Scale bar:100 μm. (K). Bar chart shows the quantification of double positive TnnT+/PCNA+ (n = 4) in panel H, two tail t-test, p < 0.05 (*). (E) Representative heart sections of bre mutant with different treatment, displaying mitotic cells (green) in the injured area at 7 dpc. Scale bar: 100 μm. (F). Bar chart shows the quantification of mitotic cells (n = 3–4) in panel C was significantly different between each group at p < 0.01 (**), two tail t-test. (G). Representative heart sections of bre mutant zebrafish with different treatment show the α-SMA (green, white arrowhead) at 4 dpc. |