
- Title
-
Ezh1 arises from Ezh2 gene duplication but its function is not required for zebrafish development
- Authors
- Völkel, P., Bary, A., Raby, L., Chapart, A., Dupret, B., Le Bourhis, X., Angrand, P.O.
- Source
- Full text @ Sci. Rep.
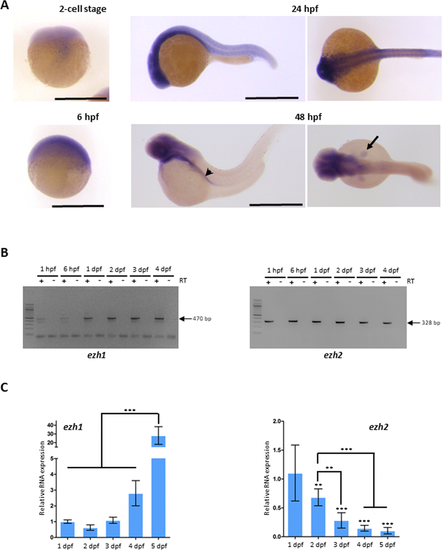
Ezh1 expression during zebrafish development. (A) In situ hybridization at the 2-cell stage, 6 hpf, 24 hpf and 48 hpf showing that ezh1 transcripts are maternally provided (2-cell stage) and showing zygotic ezh1 mRNA distribution during early development. The arrowhead shows the gut and the arrow the pectoral fin bud. Scale bar is 500 μm. (B) RT-PCR analysis showing detection of ezh1 and ezh2 mRNAs at 1 hpf, 6 hpf, 1 dpf, 2 dpf, 3 dpf and 4 dpf. The reverse transcriptase (RT) was included (+) or not (−) in the reaction, as indicated. (C) RT-qPCR showing that relative ezh1 expression increases during larval development from 1 dpf to 5 dpf whereas ezh2 expression decreases. Three independent experiments were performed and error bars represent standard deviation. Statistical analysis was performed using a one-way ANOVA with Tukey’s post hoc test. **P < 0.01; ***P < 0.001. |
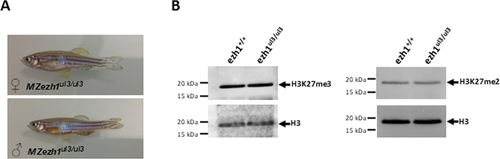
Ezh1 ul3/ul3 zebrafish mutants present a normal phenotype. (A) Pictures of 6 month-old MZezh1ul3/ul3 mutant female (top) and male (bottom) zebrafish from the F2 generation of incross mutant fish. (B) Global trimethylation (H3K27me3) and demethylation (H3K27me2) of lysine 27 of histone H3 is not affected in ezh1ul3/ul3 mutants. Total histones from pools of 10 larvae at 9 dpf from wild-type or ezh1ul3/ul3 crosses as indicated, were extracted and 5 µg of total histones were analyzed by western blotting using specific anti-H3K27me3 or anti-H3K27Me2 antibodies and an anti-H3 antibody as a control. |
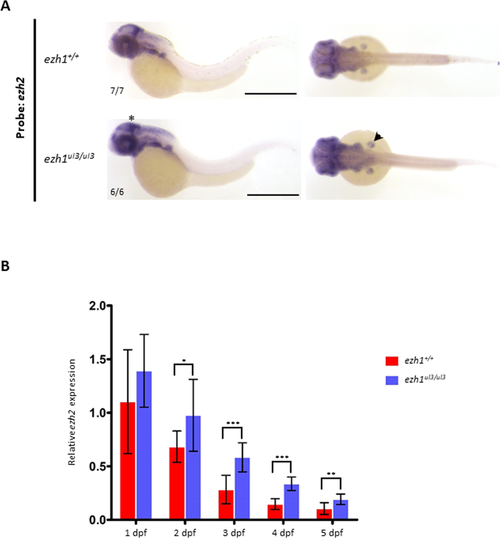
Loss of ezh1 function leads to an increase in ezh2 expression. (A) In situ hybridization showing ezh2 expression in representative embryos at 48 hpf from wild-type (Top) and ezh1ul3/ul3 crosses. A slight increase in the ezh2 signal at both sides of the midbrain-hindbrain boundary (asterisk) and in the pectoral fin buds (arrowhead) of MZezh1ul3/ul3 embryos is observed. Scale bar is 500 μm. The numbers indicate the number of embryos with the displayed compared to the total number of embryos analyzed. (B) Expression analysis of ezh1 in wild-type and MZezh1ul3/ul3 embryos and larvae at 1, 2, 3, 4 and 5 dpf quantified by RT-qPCR show an increase of ezh2 expression in MZezh1ul3/ul3 mutants. Three independent experiments were performed and statistical analysis was conducted using Student’s t-test. *P < 0.05; **P < 0.01; ***P < 0.001. |

ZFIN is incorporating published figure images and captions as part of an ongoing project. Figures from some publications have not yet been curated, or are not available for display because of copyright restrictions. PHENOTYPE:
|