FIGURE SUMMARY
Title

Zebrafish as a Model for the Study of Live in vivo Processive Transport in Neurons

Authors
Bercier, V., Rosello, M., Del Bene, F., Revenu, C.
Source
Full text @ Front Cell Dev Biol

Construct expression and cell type selection. (A) Injection of DNA constructs coding for fusion proteins can be restricted to a single cell type by use of the Gal4/UAS system. (B) In this example, we injected a UAS construct labeling mitochondria (phb, prohibitin-GFP see schematics in A) combined with a membrane reporter (tagRFP-Caax). We obtained labeling of a single primary motor neuron (MN; in the Tg(mnx1:gal4) background) and a single retinal ganglion cell (RGC; in the Tg(brn3c:gal4) background), respectively, in the embryonic spinal cord (48 hpf) and in the larval optic tectum (4 dpf). (C) Time-lapse imaging of mitochondria (1 Hz for 10 min) was performed on these cell types, and transport dynamics were calculated from kymograms. Here, we show example of the disparity in transport metrics that can arise when comparing different cell types for a single cargo (MN n = 7 cells/44 anterograde runs; RGC n = 7 cells/37 anterograde runs). ∗∗p < 0.01, ∗∗∗∗p < 0.0001.

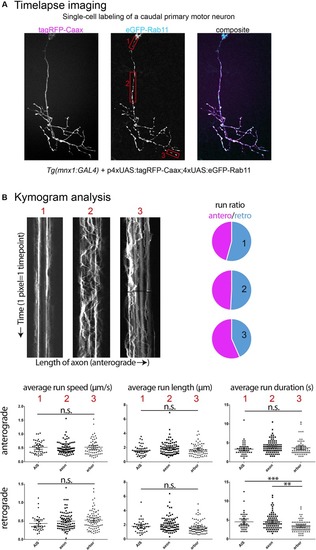
Examples of time-lapse analysis. (A) As described in Figure 1A, single cell labeling of primary motor neurons was obtained for recycling endosomes (Rab11a-eGFP), combined with a membrane reporter (tagRFP-Caax) to identify cell type. Red boxes: Three cell compartments were imaged (2 Hz for 5 min), 1-axon initial segment, 2-mid-axonal segment, 3-axonal arbor segment. (B) Kymograms were generated from the time-lapses acquired (Kymograph tool, ImageJ) and a variety of transport metrics can be calculated manually (compiled in Excel, statistics in Graphpad Prism6). In this example, significant differences between neuronal segments are detected for the transport direction ratio (anterograde/retrograde), and retrograde run duration (n = 3 cells; AIS n = 47/54 anterograde/retrograde runs; mid-axon n = 85/82 anterograde/retrograde runs; arbor n = 63/86 anterograde/retrograde runs). ∗∗p < 0.01, ∗∗∗p < 0.001.

Acknowledgments
This image is the copyrighted work of the attributed author or publisher, and ZFIN has permission only to display this image to its users. Additional permissions should be obtained from the applicable author or publisher of the image. Full text @ Front Cell Dev Biol