
- Title
-
Sleep increases chromosome dynamics to enable reduction of accumulating DNA damage in single neurons
- Authors
- Zada, D., Bronshtein, I., Lerer-Goldshtein, T., Garini, Y., Appelbaum, L.
- Source
- Full text @ Nat. Commun.
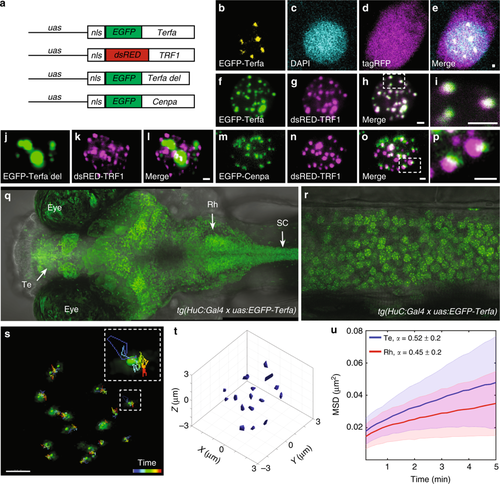
Imaging single chromosome dynamics in live larvae. a The DNA constructs were used to express telomere, centromere, and truncated telomere markers. b–e One-plane view of a representative neuron that expresses cellular tagRFP (magenta) and nuclear EGFP-Terfa (yellow) telomeric markers in live larvae. f–i Co-localization of zebrafish (f) and human (g) telomeric markers in the nucleus of a zebrafish neuron. j–l Co-expression of truncated zebrafish (j) and human (k) telomeric markers. m–p Co-expression of centromere (m) and telomere (n) markers. Dorsal (q) and lateral (spinal cord, r) views of 6-dpf tg(HuC:Gal4)/tg(uas:EGFP-Terfa) larvae (Te telencephalon, Rh rhombencephalon, SC spinal cord). s Live time-lapse imaging of a single neuron nucleus shows the movement of chromosomes measured over 9.5 min. Dashed box shows high magnification of a single trajectory. t 3D single-particle tracking (SPT) shows the volume of motion of chromosomes in a single nucleus. u In all Te and Rh neurons, the time-averaged mean square displacement (MSD) for telomeres trajectory (Te: n = 340 chromosomes, Rh: n = 475 chromosomes). Lines represent the means, and the shaded area represents the standard deviation (SD). Scale bar = 1 µm EXPRESSION / LABELING:
|

ZFIN is incorporating published figure images and captions as part of an ongoing project. Figures from some publications have not yet been curated, or are not available for display because of copyright restrictions. PHENOTYPE:
|
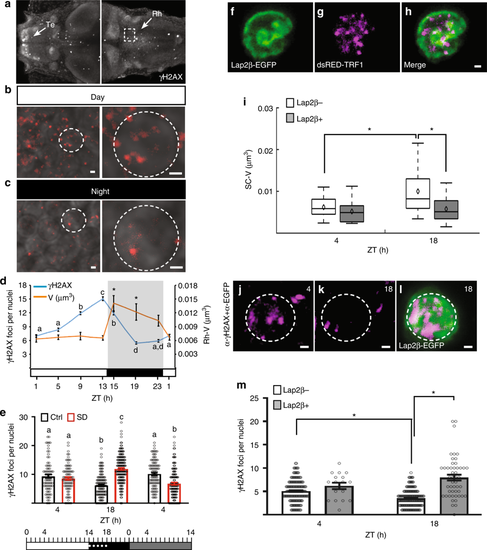
Chromosome dynamics are essential for reducing the number of accumulating DSBs. a–c Dorsal view of 6 dpf larvae stained with γH2AX. a Arrows indicate the telencephalon (Te) and rhombencephalon (Rh). Dashed box showing the Rh represents the area analyzed in d and e. Representative images from the Rh region during day (b) and night (c) are shown. Dashed circle indicates a single neuron. d The number of DSBs (P = 1 × 10⁻¹⁶, F = 118, degrees of freedom = 7) and chromosome dynamics (*P = 8 × 10⁻⁷, F = 7, degrees of freedom = 7) in single nuclei over 24 h, in 14 h light/10 h dark cycle. Determined by one-way ANOVA followed by a Tukey test. Lower case letters indicate significant changes between γH2AX groups. Asterisks indicate significant changes between chromosome dynamics groups. White and black horizontal bars represent light and dark periods, respectively. e Numbers of DSBs (dot plot, means ± SEM). Ctrl: day (n = 83 cells), night (n = 131 cells), subjective day (n = 105 cells). SD: day (n = 86 cells), night (n = 170 cells), subjective day (n = 135 cells). P = 1 × 10⁻⁶, F = 62.04, degrees of freedom = 2, determined by two-way ANOVA followed by a Tukey test. White, black, and gray rectangles represent day, night, and subjective day, respectively. Dotted white line represents the sleep deprivation (SD) period. f–h Co-expression of Lap2β-EGFP (f) and human telomeric markers (g) in SC-neuronal nucleus. i Volume of chromosome dynamics in control (Lap2β−, day: n = 25; night: n = 21 cells) and Lap2β-overexpressing cells (Lap2β+, day: n = 25; night: n = 19 cells). *P = 0.026, F = 5.1, degrees of freedom = 1, determined by two-way ANOVA followed by a Tukey test. j–l Representative images of double immunohistochemistry using α-γH2AX (magenta) and α-EGFP (green) in single SC neurons during day (j) and night (k, l). Dashed circle indicates a single nucleus. m The number of DSBs (dot plot, means ± SEM) in control (Lap2β−, day: n = 177; night: n = 177 cells) and Lap2β-overexpressing cells (Lap2β+, day: n = 17; night: n = 49 cells). *P = 1 × 10⁻⁶, F = 18.8, degrees of freedom = 1, determined by two-way ANOVA followed by a Tukey test. Zeitgeber time (ZT4)-day, ZT18-night. Boxplots: black diamond represents the mean, boxes indicate the median and the 25th-to-75th percentiles, whiskers extend to the most extreme data points. Letters or asterisks indicate significant differences. Scale bar = 1 µm
|
|
ZFIN is incorporating published figure images and captions as part of an ongoing project. Figures from some publications have not yet been curated, or are not available for display because of copyright restrictions. PHENOTYPE:
|
|
ZFIN is incorporating published figure images and captions as part of an ongoing project. Figures from some publications have not yet been curated, or are not available for display because of copyright restrictions. PHENOTYPE:
|