
- Title
-
Light sheet microscopy with acoustic sample confinement
- Authors
- Yang, Z., Cole, K.L.H., Qiu, Y., Somorjai, I.M.L., Wijesinghe, P., Nylk, J., Cochran, S., Spalding, G.C., Lyons, D.A., Dholakia, K.
- Source
- Full text @ Nat. Commun.
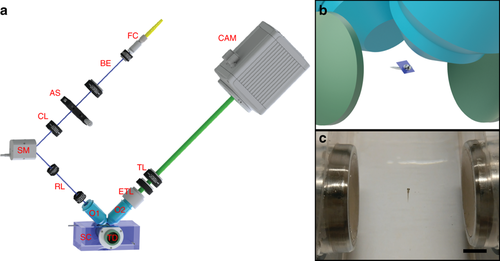
Light sheet fluorescence microscopy setup with an acoustic trapping chamber. a Schematic of the setup. The light sheet is scanned along the detection axis by the scanning mirror (SM) whilst the detection plane is synchronized with the light sheet by an electrically tunable lens (ETL). The acoustic sample chamber (SC) with acoustic transducers (TD) holds the sample while the images are taken. FC fibre collimator, BE beam expander, AS adjustable slit, CL cylindrical lens, RL relay lenses, O1 & O2 objectives, TL tube lens, CAM camera. b Schematic showing the acoustic transducers, trapped sample, the light sheet and the objective lenses. c Picture showing an acoustically trapped 5-days-post-fertilization (dpf) zebrafish larva. Scale bar denotes 5 mm
|

Velocity vector plot of the zebrafish heart estimated using optical flow analysis illustrating stages of the cardiac cycle: (a) contraction of the ventricle; (b) relaxation of the ventricle; (c) contraction of the atrium. Time elapsed relative to the first frame is noted on the figures. Scale bar is 50 μm (see also Supplementary Movie 5)
|
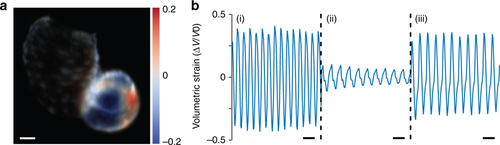
Contractility mapping of the zebrafish heart. a Volumetric strain rate (change in volume between frames) corresponding to Fig. 3a. Scale bar is 50 μm. b Selected traces of the total volumetric strain of the ventricle (i) before the drug is added (20 min), (ii) after the drug is added (50 min), and (iii) after the drug is washed away (150 min). The scale bar denotes 1 s (see also Supplementary Movie 6)
|