
- Title
-
Liposome-Mediated Drug Delivery in Larval Zebrafish to Manipulate Macrophage Function
- Authors
- Wu, Z., Koh, B., Lawrence, L.M., Kanamala, M., Pool, B., Svirskis, D., Dalbeth, N., Astin, J.W., Crosier, K.E., Crosier, P.S., Hall, C.J.
- Source
- Full text @ Zebrafish
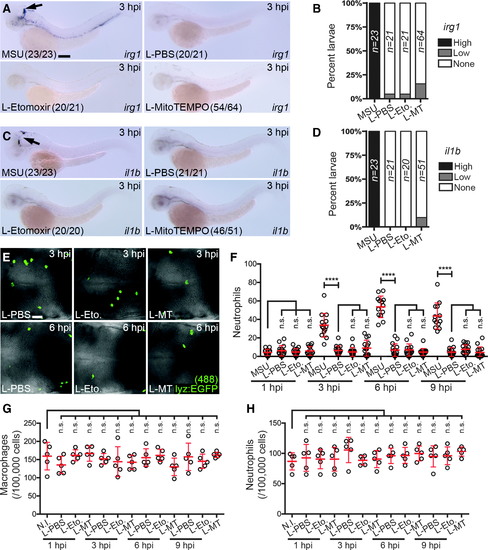
Injecting liposomes alone does not activate macrophages. (A)Expression of irg1 after injection of liposomal PBS (L-PBS), etomoxir (L-Etomoxir), or MitoTEMPO (L-MitoTEMPO), as detected at 3 hpi. MSU-injected larvae are included here as a positive control for comparison. (B)Temporal quantification of irg1 expression, as percent larvae displaying high (as shown in A), low, and no expression (none). (C) Expression of il1bafter injection of L-PBS, L-Etomoxir, and L-MitoTEMPO, as detected at 3 hpi. MSU-injected larvae are included here as a positive control for comparison. (D) Temporal quantification of il1b expression, as percent larvae displaying high (as shown in C), low, and no expression (none). (E)Immunofluorescence detection of neutrophils within the hindbrain region of Tg(lyz:EGFP) larvae after L-PBS, L-Etomoxir (L-Eto.) or L-MitoTEMPO (L-MT) injection, as detected at 3 and 6 hpi. (F) Temporal quantification of neutrophils, as detected in (E), compared with MSU crystal-injected larvae (n = 13–15 larvae/treatment). (G, H) Flow cytometry quantification of macrophages (G) and neutrophils (H) from Tg(mpeg1:EGFP) and Tg(lyz:EGFP) larvae, respectively, after L-PBS, L-Etomoxir (L-Eto.), or L-MitoTEMPO (L-MT) injection (compared with N.I. larvae), quantified at 1, 3, 6, and 9 hpi. Black arrows mark irg1- and il1b-expressing macrophages in hindbrain. All views anterior to left. Error bars display mean ± SD. ****p < 0.0001, one-way ANOVA, Dunnett's post hoc test. Scale bars, 100 μm in (A) and 50 μm in (E). ANOVA, analysis of variance; MSU, monosodium urate; N.I., noninjected; n.s, not significant. |
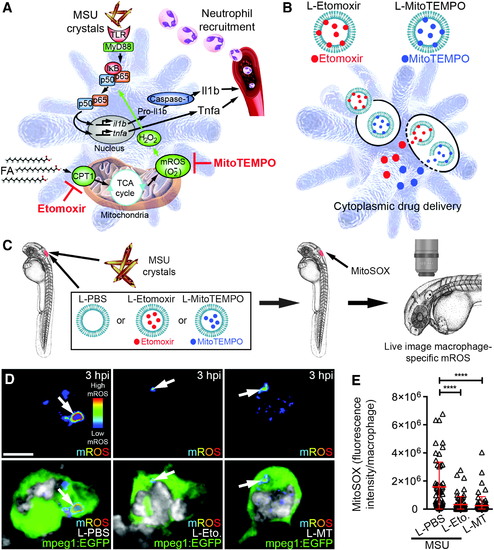
Liposomal etomoxir and MitoTEMPO suppress MSU crystal-driven mROS production in macrophages. (A) Schematic of immunometabolic mechanism of macrophage activation in response to MSU crystals and targets for etomoxir and MitoTEMPO activity. (B)Strategy to target etomoxir and MitoTEMPO to macrophages using liposomal formulations (L-Etomoxir and L-MitoTEMPO). (C) Schematic illustrating delivery of MSU crystals with liposomes and subsequent live imaging of mROS. (D) Live imaging of macrophage-specific mROS production (white arrows) within (mpeg1:EGFP) larvae co-injected with MSU crystals and liposomal PBS (L-PBS), etomoxir (L-Etomoxir/L-Eto.), or MitoTEMPO (L-MitoTEMPO/L-MT), at 3 hpi (MitoSOX signal is displayed as a heatmap with warmer colors representing higher levels of mROS). Marina Blue-labeled liposomes are pseudocolored in grayscale. (E)Quantification of macrophage-specific mROS production, as detected in (D). Error bars display mean ± SD. ****p < 0.0001, one-way ANOVA, Dunnett's post hoc test. Scale bar, 10 μm in (D). mROS, mitochondrial reactive oxygen species. |
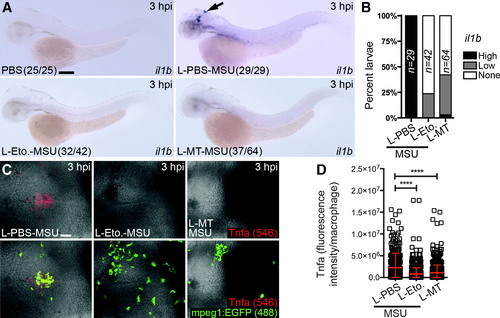
Liposomal etomoxir and MitoTEMPO suppress MSU crystal-driven expression of il1b and production of Tnfa by macrophages. (A)Expression of il1b after co-injection of MSU crystals with liposomal PBS (L-PBS), etomoxir (L-Eto.), or MitoTEMPO (L-MT) compared with PBS-only injected controls, as detected at 3 hpi. (B) Temporal quantification of il1bexpression, as detected in A. (C) Immunofluorescence detection of Tnfa within the hindbrain of Tg(mpeg1:EGFP) larvae co-injected with MSU crystals and L-PBS, L-Eto, or L-MT, as detected at 3 hpi. (D) Quantification of Tnfa, as detected in (C) (n = 15 larvae/treatment). Black arrow marks il1b-expressing macrophages in hindbrain. All views anterior to left. Error bars display mean ± SD. ****p < 0.0001, one-way ANOVA, Dunnett's post hoc test. Scale bars, 100 μm in (A) and 50 μm in (C). |
Liposomal etomoxir and MitoTEMPO suppress neutrophil recruitment to injected MSU crystals. (A) Immunofluorescence detection of neutrophils within the hindbrain of Tg(lyz:EGFP) larvae co-injected with MSU crystals and L-PBS, L-Eto, or L-MT, as detected at 3 and 6 hpi, compared with MSU crystal-injected larvae immersed in concentration-matched FD, with corresponding DMSO-treated controls. (B) Temporal quantification of neutrophils within the hindbrain, as detected in (B), n = 13–15 larvae/treatment. All views anterior to left. Error bars display mean ± SD. ****p < 0.0001, one-way ANOVA, Dunnett's post hoc test. Scale bar, 50 μm in (A). FD, free drug. |
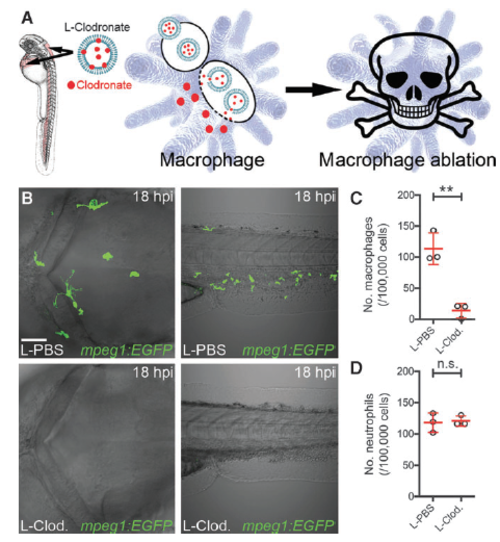
Macrophage ablation using liposomal clodronate. (A) Schematic illustrating injection of liposomal clodronate into the sinus venosus and hindbrain ventricle of larval zebrafish to target clodronate to macrophages for macrophage ablation. (B) Live imaging of the hindbrain (dorsal view) and CHT (lateral view) after injection of liposomal clodronate (L-Clod.) or liposomal PBS (L-PBS) into 30 hpf Tg(mpeg1:EGFP) larvae, imaged at 18 hours postinjection (hpi). (C , D) Flow cytometry quantification of macrophages (C ) and neutrophils (D ) from dissociated 2 dpf (18 hpi) liposomomal PBS- and liposomal clodronate-injected Tg(mpeg1:EGFP) (C ) and Tg(lyz:EGFP) (D ) larvae (n = 3 biological replicates, * 30 larvae per group). All views anterior to left. Error bars display mean – SD. **P < 0.01, Student’s t -test. Scale bar, 50 l m in (B) . n.s., not significant. CHT, caudal hematopoietic tissue; dpf, days post fertilization; hpf, hours post fertilizaton |