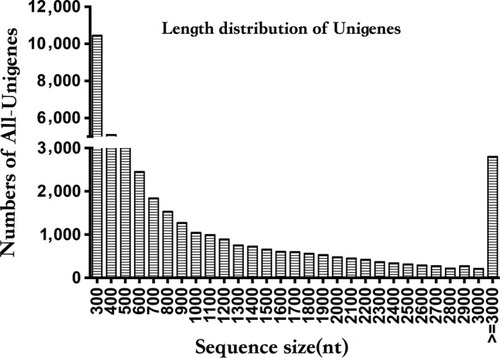
Length distribution of All‐unigenes

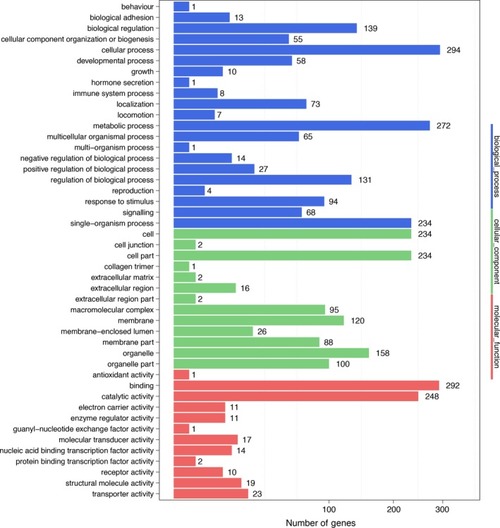
Gene Ontology function classification of All‐unigenes [Colour figure can be viewed at http://www.wileyonlinelibrary.com]

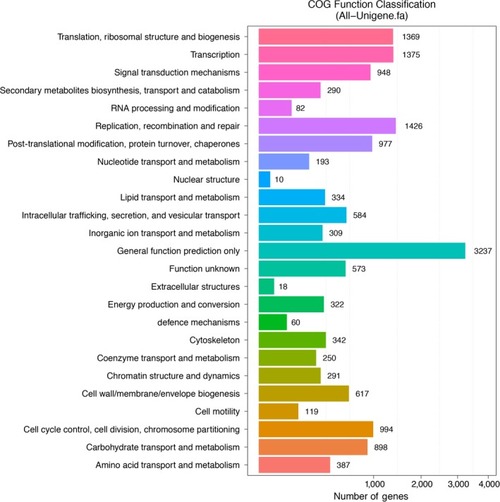
Clusters of Orthologous Groups (COG) function classification of All‐unigenes [Colour figure can be viewed at http://www.wileyonlinelibrary.com]

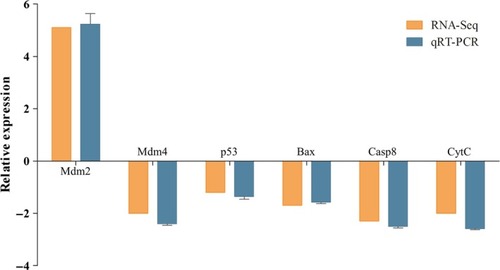
Comparison of the fold change expression of six differentially expressed genes involved in p53 signalling pathway as determined by RNA‐seq and qPCR. The results of qPCR were evaluated by normalizing to β‐actin gene [Colour figure can be viewed at http://www.wileyonlinelibrary.com]

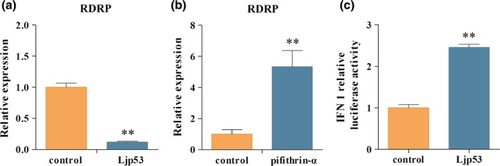
Effects of Ljp53 on RGNNV replication and zebrafish IFN1 promoter activity. (a) qRT‐PCR detection of RDRP in LJB cells transfected with pcDNA‐Ljp53 or control plasmid at 48 hr post‐RGNNV infection. (b) qRT‐PCR detection of RDRP in LJB cells treated with DMSO (control) or pifithrin‐α. (c) HEK293T cells were analysed at 48 hr after transfected with the pRL‐TK, pcDNA3.1(+) or pcDNA‐Ljp53 plasmids together with zebrafish IFN1 promoter‐driven reporter plasmid, and the luciferase activity was determined. Asterisks indicate significant differences between groups (**p < 0.01) [Colour figure can be viewed at http://www.wileyonlinelibrary.com].

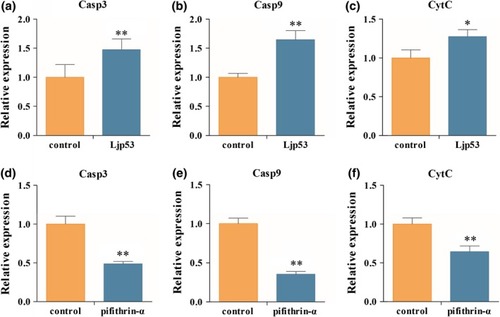
Expression of apoptosis‐related genes. qRT‐PCR detection of Casp3 (a), Casp9 (b) and CytC (c) in LJB cells transfected with pEGFP‐N3 or pEGFP‐Ljp53 plasmid at 48 hr post‐RGNNV infection. qRT‐PCR detection of Casp3 (d), Casp9 (e) and CytC (f) in LJB cells treated with DMSO or pifithrin‐α. Asterisks indicate the significant differences between groups at 48 hpi (*p < 0.05; **p < 0.01) [Colour figure can be viewed at http://www.wileyonlinelibrary.com].

Acknowledgments
This image is the copyrighted work of the attributed author or publisher, and ZFIN has permission only to display this image to its users. Additional permissions should be obtained from the applicable author or publisher of the image. Full text @ J. Fish Dis.