
- Title
-
Global transcriptional analysis identifies a novel role for SOX4 in tumor-induced angiogenesis
- Authors
- Vervoort, S.J., de Jong, O.G., Roukens, M.G., Frederiks, C.L., Vermeulen, J.F., Lourenço, A.R., Bella, L., Vidakovic, A.T., Sandoval, J.L., Moelans, C., van Amersfoort, M., Dallman, M.J., Bruna, A., Caldas, C., Nieuwenhuis, E., van der Wall, E., Derksen, P., van Diest, P., Verhaar, M.C., Lam, E.W., Mokry, M., Coffer, P.J.
- Source
- Full text @ Elife
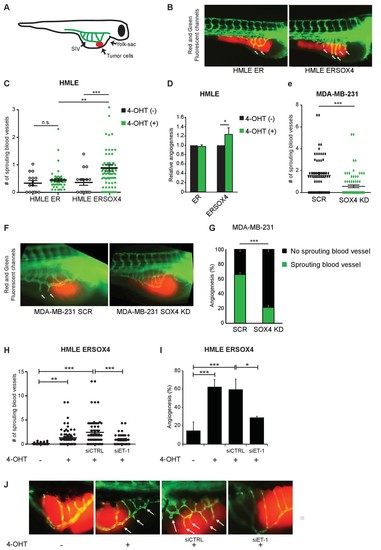
SOX4 controls tumor-induced angiogenesis in vivo in a zebrafish tumor-xenograft model. (A) Schematic representation of the zebrafish tumor-xenograft model, with the subintestinal vessels indicated in green (SIV) and tumor cells in red. (B) Representative images of zebrafish injected with ER-control and ERSOX4 HMLE cells treated with 4-OHT. Arrows indicate newly formed blood vessels. (C) Quantification of the number of ectopic sprouts observed per fish injected with ER-control and ERSOX4 HMLE cells. Individual data points and data represented as mean ± SD of three independent biological replicates (**p-value<0.01, ***p-value<0.001; ANOVA). (D) Quantification of the relative increase in ectopic sprouting in fish injected with 4-OHT treated relative to untreated ER-control and ERSOX4 cells. Data represented as mean ± SD of three independent biological replicates (* p-value<0.05, Student’s t-test). (E) Quantification of the number of ectopic sprouts in fish injected with SCR control and SOX4 KD MDA-MB-231 cells. Results obtained from three independent biological replicates (***p-value<0.001, Student’s t-test). (F) Representative images of zebrafish injected with SCR control or SOX4 KD MDA-MB-231 cells. Arrows indicate newly formed blood vessels (G) Quantification of the number of fish injected with MDA-MB-231 cells with or without ectopic sprouting. Results obtained from three independent biological replicates (***p-value<0.001, Student’s t-test). (H) Quantification of the number of ectopic sprouts observed per fish injected with 4-OHT-treated ERSOX4 HMLE cells exposed with siRNA control or siRNA targeting ET-1. Individual data points and data represented as mean ± SD (*p-value<0.05, ANOVA). (I) Quantification of the relative increase in ectopic sprouting in fish injected with 4-OHT treated ERSOX4 HMLE cells exposed with siRNA control or siRNA targeting ET-1. Data represented as mean ± SD of three independent biological replicates (*p-value<0.05, ***p-value<0.001; ANOVA). (J) Representative images of zebrafish injected with 4-OHT-treated ERSOX4 HMLE cells exposed with siRNA control or siRNA targeting ET-1. Arrows indicate newly formed blood vessels. |
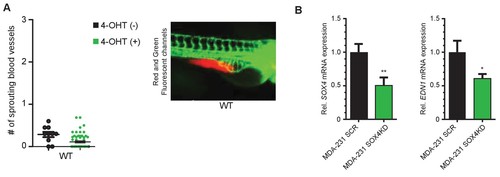
Analysis of angiogenic potential of HMLE WT cells. SOX4 and EDN1 mRNA expression in SOX4-depleted MDA-MB-231 cells. (A) Quantification of ectopic sprouting in zebrafish tumor-xenograft model using wild-type (WT) HMLE cells in presence of absence of 4-OHT. (B) qPCR validation of SOX4 knockdown (KD) relative to SCR control in MDA-MB-231 cells with matching EDN1 expression. |