
- Title
-
A cargo model of yolk syncytial nuclear migration during zebrafish epiboly
- Authors
- Fei, Z., Bae, K., Parent, S.E., Wan, H., Goodwin, K., Theisen, U., Tanentzapf, G., Bruce, A.E.E.
- Source
- Full text @ Development
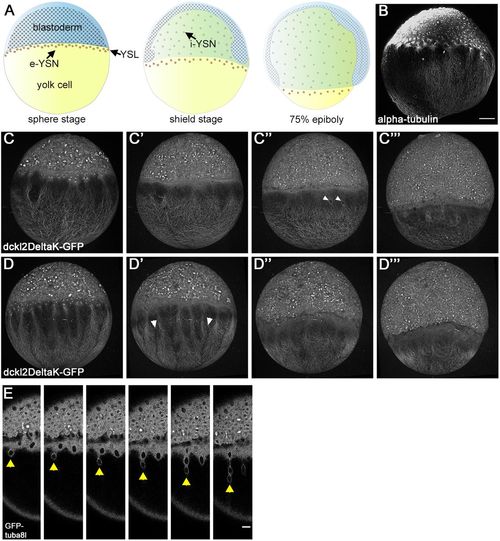
Yolk cell microtubule dynamics during epiboly. Panels are lateral views with the animal pole to the top. (A) Embryo schematics during epiboly. (B) Alpha-tubulin antibody staining of sphere-stage embryo. (C-D‴) Live confocal projections of 2 Tg:(XlEef1a1:dclk2DeltaK-GFP) embryos from early to late epiboly (left to right). In C″ arrowheads indicate migrating e-YSN. In D′ arrowheads indicate gaps between microtubule branches. (E) Stills from confocal time-lapse of a Tg:(XlEefla1:GFP-tuba81) embryo during mid-epiboly. Arrowheads indicate migrating e-YSN forming a chain. Scale bars: 100 µm in B-D‴; 25 µm in E. |
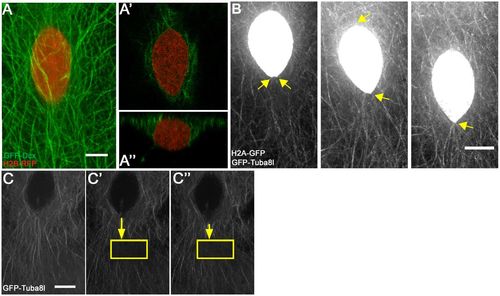
E-YSN move along and beneath the microtubule network. (A) Confocal projection of e-YSN labeled with H2B-RFP and microtubules labeled with GFP-Dcx. (A′) Deep single plane shows microtubules around the nucleus. (A″) Orthogonal view shows e-YSN is largely below the microtubule network. (B) Stills from Movie 2 of Tg:(XlEefla1:GFP-tuba81) embryo injected with h2a-gfp RNA. The e-YSN becomes elongated and leading tip of e-YSN becomes pointed during migration (yellow arrows). (C-C″) Selected confocal projections of a photobleached Tg:(XlEefla1:GFP-tuba81) embryo injected with h2a-gfp RNA. Yellow rectangle marks the photobleached region and shortening yellow arrow shows that the e-YSN moves towards the photobleached region. Pre-bleach, C; immediately post-bleach, C′; 30 s post-bleach, C″. Scale bars: 7 µm in A; 10 µm in B; 9 µm in C. |
E-YSN migration pathways along microtubules bundled by Rassf1. Lateral view of stills from confocal time lapse (Movie 3). Nuclei labeled with H2B-RFP and microtubules with GFP-Dcx, and Rassf1 expressed in the YSL. White asterisks indicate regions depleted of microtubules. White arrowhead indicates a microtubule bundle flanked by depleted regions. Several nuclei move down this central bundle. Yellow and blue arrowheads indicate nuclei that move across thin microtubule bundles oriented perpendicularly to the animal-vegetal axis. Pink arrowhead indicates a pair of nuclei that move animally. Bracket in panel 1 indicates YSL. n=8. Scale bar: 50 µm |

E-YSN migrate away from MTOCs. (A-A′) PIV analysis of EB3-GFP fluorescent comet flow. Single-plane time-lapse movie analyzed; blastoderm is at the top right (A). Combined rose plot of PIV vector angles from five confocal time-lapse movies of embryos expressing EB3-GFP (A′). PIV vectors were averaged over 30 s. Radial axis (×105) indicates the number of vectors from all movies in each bin. (B,C) Lateral views of confocal projections of embryos expressing H2B-RFP and EB3-GFP. Vegetally positioned MTOCs in the YSL indicated with white arrows. n=9 (B). Two e-YSN migrating away from the MTOC indicated by the yellow arrow. n=6 (C). Scale bars: 50 µm in A; 20 µm in B; 5 µm in C. |

Knockdown of kinesin and dynein decrease e-YSN migration speeds. (A) Violin plot of e-YSN migration speeds: medians indicated by white dots, thick gray lines indicate interquartile ranges, thin gray lines indicate 95% confidence intervals. Mean speeds: wild-type YSN (WT): 2.082±0.259 μm/min; Klc1 (DN-Kinesin): 1.485±0.483 μm/min; DynamitinG1 (DN-Dynein): 1.711±0.380 μm/min; and C-syne2a (C-syne): 1.465±0.427 μm/min. (B-B′) Confocal projections of Tg:(XlEef1a1:dclk2DeltaK-GFP)-injected embryos at late epiboly injected with GFP-Klc1 (B) or Citrine-DynamitinG1 (B′) showing normal microtubule organization. (C) HA antibody staining showing localization of HA-Kif5Ba around migrating e-YSN (asterisks) and leading tip (arrows). n =16. (C′) Citrine-DynamitinG1 puncta decorating an e-YSN labeled in red. Arrowhead indicates lagging side which is enriched with puncta. n=12. Scale bars: 70 µm in B; 90 µm in B′; 19 µm in C; 3 µm in C′. |