
- Title
-
Stable transgenic C9orf72 zebrafish model key aspects of the ALS/FTD phenotype and reveal novel pathological features
- Authors
- Shaw, M.P., Higginbottom, A., McGown, A., Castelli, L.M., James, E., Hautbergue, G.M., Shaw, P.J., Ramesh, T.M.
- Source
- Full text @ Acta Neuropathol Commun
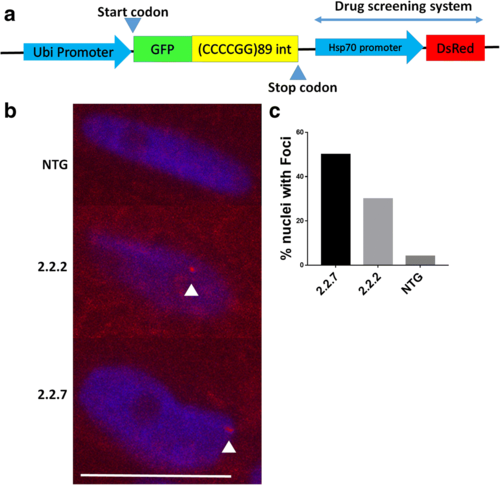
C9orf72 model zebrafish display RNA foci in the nucleus. (a) Schematic representation of the transgene inserted into 2.2 zebrafish. A zebrafish ubiquitin promotor drives GFP-DPR expression. An hsp70 promotor then drives DsRed production as a read out of cellular stress. (b) In situ hybridisation of paraffin embedded sections of 10dpf 2.2–7 zebrafish using a Cy3-conjugated (red) GC probe (GGGGCC)X4 showed that RNA foci are present in the nuclei of muscle cells. Arrow heads denote RNA foci. Scale bar = 10 μm. (c) Quantification of RNA foci showed Immunofluorescence labelling of adult zebrafish muscle tissue showed that poly-GP DPR protein localises to the nucleus in 2.2–2 and 2.2–7 transgenic zebrafish |
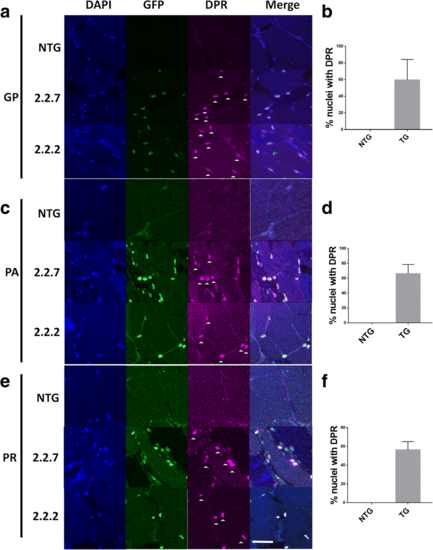
C9orf72 model zebrafish display DPR expression in the nucleus. (a,b) Immunofluorescence labelling of adult zebrafish muscle tissue showed that poly-GP DPR protein localises to the nucleus in 2.2–2 and 2.2–7 transgenic zebrafish. (c.d) Immunofluorescence labelling of adult zebrafish muscle tissue showed that poly-PA DPR protein localises to the nucleus in 2.2–2 and 2.2–7 transgenic zebrafish. (e,f) Immunofluorescence labelling of adult zebrafish muscle tissue showed that poly-PA DPR protein localises to the nucleus in 2.2–2 and 2.2–7 transgenic zebrafish. For all DPR images nuclei are stained with Hoechst (blue), GFP is stained with GFP antibody (green) and DPR proteins are stained with the relevant DPR antibody (purple), white arrow heads denote DPR positive staining. Scale bar = 25 μm for all DPR images EXPRESSION / LABELING:
|
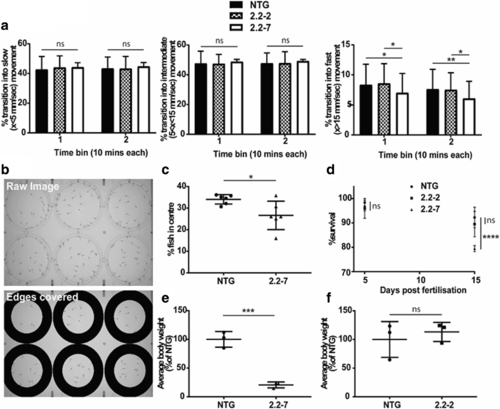
C9orf72 model zebrafish show early motor deficits, behavioural defects and reduced viability. (a) When kept under dark conditions, no difference is observed in the proportion of times fish transition into a slow movement (left) or intermediate movement (middle). However, the proportion of transitions into fast movements is significantly reduced in 2.2–7 zebrafish. N = 60 individual fish per genotype, from 3 different clutches. (b) Representative images of the plate set-up used to monitor centre avoidance behaviour in zebrafish. 30 fish were placed in each well and one image every minute was analysed. Image shown as recorded (top) and then following removal of the region around the edge of the plate for analysis (bottom). In these images 2.2–7 are placed across the top 3 wells and NTG across the bottom 3 wells. (c) Quantification of centre avoidance behaviour showing 2.2–7 zebrafish are significantly less often found in the plate centre. N = 6 clutches per genotype. (d) Survival of zebrafish did not change by 5dpf, however by 15dpf survival of the 2.2–7 line was significantly reduced compared to NTG. N = 4 clutches per genotype. (e) At 30dpf 2.2–7 zebrafish have reduced average body weight in comparison to their NTG clutch mates. N = 3 clutches per genotype. (f) At 30dpf there was no difference in average body weight between 2.2–2 zebrafish and their NTG clutch mates. N = 3 clutches per genotype. All data are shown as mean +/− standard deviation; * P < 0.05, ** P < 0.01, *** P < 0.001 and **** P < 0.0001 PHENOTYPE:
|

ZFIN is incorporating published figure images and captions as part of an ongoing project. Figures from some publications have not yet been curated, or are not available for display because of copyright restrictions. PHENOTYPE:
|
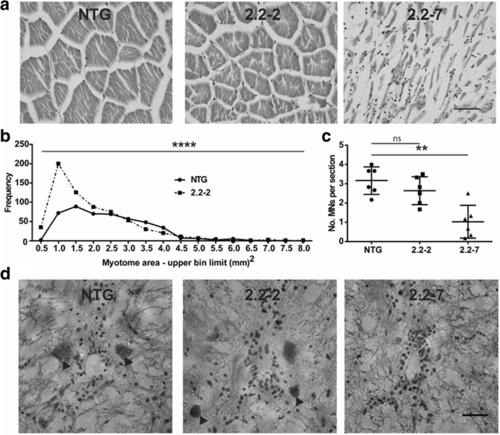
C9orf72 model zebrafish display muscle atrophy and motor neuron loss. (a) Representative H&E staining of zebrafish epaxial muscle (body muscle) myotomes. Scale bar = 50 μm. (b) Frequency distribution of 2.2–2 and NTG myotome sizes. N = 6 individual zebrafish per genotype. (c) Motor neuron counts show that 2.2–7 zebrafish have significant motor neuron loss compared to NTG. N = 6 individual fish per genotype. (d) Representative H&E staining of zebrafish spinal cord sections, motor neurons are denoted by arrowheads. Scale bar = 25 μm. Myotome size data are shown as the frequency of myotome sizes binned into defined ranges, motor neuron count data are mean +/− standard deviation; *P < 0.05, **P < 0.01, ***P < 0.001 and ****P < 0.0001 PHENOTYPE:
|
|
ZFIN is incorporating published figure images and captions as part of an ongoing project. Figures from some publications have not yet been curated, or are not available for display because of copyright restrictions. |
|
ZFIN is incorporating published figure images and captions as part of an ongoing project. Figures from some publications have not yet been curated, or are not available for display because of copyright restrictions. |