
- Title
-
Widespread Enhancer Dememorization and Promoter Priming during Parental-to-Zygotic Transition
- Authors
- Zhang, B., Wu, X., Zhang, W., Shen, W., Sun, Q., Liu, K., Zhang, Y., Wang, Q., Li, Y., Meng, A., Xie, W.
- Source
- Full text @ Mol. Cell
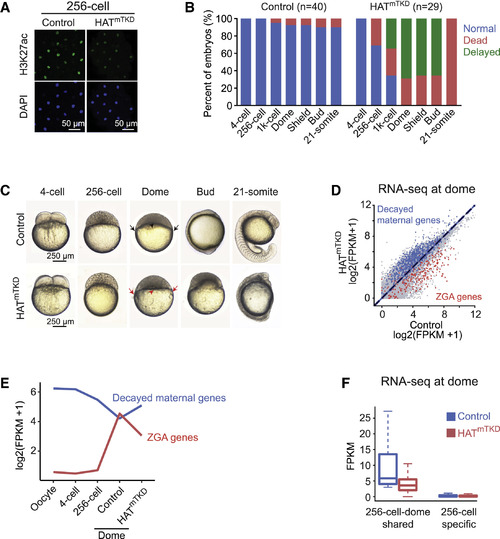
Maternal Depletion of Histone Acetyltransferases Impedes Zebrafish Embryonic Development (A) Immunofluorescence staining of H3K27ac in control and HATmTKD embryos at the 256-cell stage (STAR Methods). H3K27ac (green) and DNA (DAPI, blue) are shown. Embryos derived from oocytes injected with standard control MO via OMIS were used as controls. (B) Bar plots showing fractions of embryos that are normal, dead, or delayed in development at different developmental stages between control (left, injected with standard control MO) and HATmTKD (right) embryos (n, number of embryos). (C) Representative images of control (top) and HATmTKD (bottom) embryos across different developmental stages. The black arrowhead in the control dome embryo indicates the doming yolk syncytium, and black arrows indicate the spreading of the YSL (yolk syncytial layer) over the yolk (control embryo). The corresponding red arrowhead and arrows indicate that no such cell movements occur in the HATmTKD embryo. (D) Scatterplot comparing gene expression (log2[FPKM + 1]) between control and HATmTKD embryos at the dome stage. Red dots, non-maternal ZGA genes; blue dots, decayed maternal genes. (E) Distribution of average RNA levels for both non-maternal ZGA genes (red) and decayed maternal genes (blue) across different developmental stages, including both control and HATmTKD embryos at the dome stage. (F) A boxplot comparing RNA levels for 256-cell-dome shared genes (left) and 256-cell-specific genes (right) for control (blue) and HATmTKD (red) embryos. Genes with maternal expression (FPKM > 5 in oocyte, 4-cell or 256-cell) are excluded to avoid confounding effects. For 256-cell-dome shared genes, only those that show expression (FPKM > 3) in the wild-type (WT) at the dome stage are included for analysis. |