
- Title
-
Intestinal microbiome adjusts the innate immune setpoint during colonization through negative regulation of MyD88
- Authors
- Koch, B.E.V., Yang, S., Lamers, G., Stougaard, J., Spaink, H.P.
- Source
- Full text @ Nat. Commun.
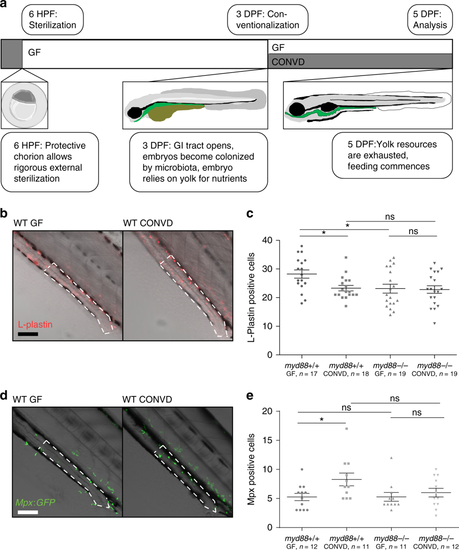
Changes to immune cell composition in the gut is Myd88 dependent. a Schematic representation of the developmental features of early zebrafish larvae which form the foundation of this experimental approach. b Representative images of distal intestines of germ-free (GF) and conventionalized (CONVD) wildtype (WT) larvae following L-plastin staining. Composite images of bright-field and L-plastin signal from confocal maximum intensity Z-projection in red. c WT larvae under germ-free conditions exhibit a significantly elevated leukocyte presence in the distal intestine, compared to conventionalized. This elevated leukocyte presence was no longer detectable under the same conditions in myd88 deficient larvae. Figure is representative of three independent replications. d Representative live microscopy images of distal intestine of GF and CONVD larvae of the Mpx:GFP reporter zebrafish line. Bright-field overlaid with confocal maximum intensity Z-projection in green. e Germ-free larvae exhibit significantly reduced neutrophil infiltration in the distal intestine compared to conventionalized larvae. No significant difference was observed in myd88 deficient backgrounds. Figure is made from pooled data from three biological replicates. b, d an area of intestine extending 4 somites proximal to the cloaca, representing the area of counting, is outlined in white dashed lines. scale bars represent 100 µm. c, e each data point represent cell counts from one larvae based on confocal z-stacks acquired at 20 times magnification. Error bars represent standard error of the mean. *P ≤ 0.05 by two-way ANOVA with Bonferroni correction for multiple comparisons |
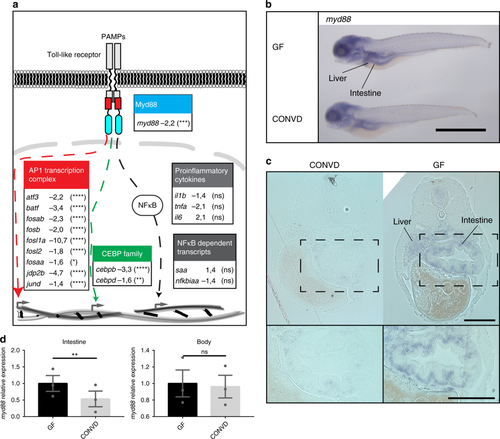
Microbes transcriptionally suppress Myd88 and downstream signaling components. a Graphic representation of the canonical TLR stimulated Myd88 dependent transcriptional signaling though the AP1 transcription complex (red), the CCAAT/enhancer binding protein family (green) or the NF-κB nuclear translocation (gray), along with associated gene names and fold-change values in the conventionalized group relative to germ-free. Nine transcription factors of the AP1 transcription complex and two members of the CCAAT/enhancer binding protein (C/EBP) family exhibited significant transcriptional suppression upon colonization. The activation of NF-κB is not readily observable by transcriptomics, however neither the NF-κB dependent transcripts serum amyloid A (saa) or NF-κB inhibitor Alpha a (nfkbiaa) or the proinflammatory cytokines normally associated with NF-κB activation were significantly regulated. It should be noted that the transcriptional foldchanges are derived from whole-body transcriptomics and that it cannot be concluded that the transcriptional changes represented here all take place in the same cells, even though they are part of the same regulatory pathway. Statistical evaluations represent the Benjamini-Hochberg adjusted P-values of the RNAseq data comparing conventionalized embryos to germ-free controls. *P ≤ 0.05; **P ≤ 0.01; ***P ≤ 0.001; ****P ≤ 0.0001; ns = not significant. b Whole-mount in situ hybridization reveals that myd88 is expressed primarily in the intestine and liver in 5 DPF embryos. Scalebar represents 1 mm. c 2 µm transverse sections of plastic embedded in situ hybridization of myd88 comparing the pattern in a germ-free and a conventionalized embryo. Scalebar represents 100 µm. d qPCR analysis comparing the relative expression levels of myd88 in germ-free versus conventionalized 5 DPF embryos in intestines versus body tissues, (mean ± s.e.m., n = 3 biological replicates, 30 embryos per group), **P ≤ 0,01; by Student’s t-test |
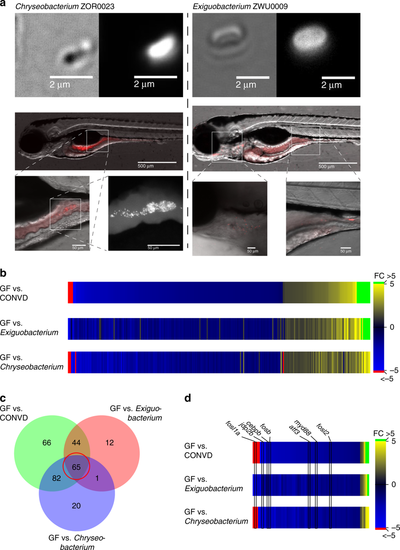
Mono-associated treatment groups help refine the colonization sensitive genes. a Chryseobacterium ZOR0023 (phylum Bacteriodetes) and Exiguobacterium ZWU0009 (phylum Firmicutes) visualized microscopically using the amine-reactive Dye-light fluorescent labeling system, colonizes different parts of the intestinal tract of the larvae. By plating homogenized embryos, the colonizing CFU burden was estimated to be approximately 70–75 for each, colonization patterns represent observations made in three independent colonization experiments. b Heat map displaying the normalized fold changes of 290 transcripts which reached statistical significance as differentially expressed in at least one of the colonized samples compared to germ-free. c Venn diagram showing the overlap in genes that make the significance cut-off for differential expression in the different colonized groups versus germ-free. d The central group of genes in the Venn diagram defines a group of 65 genes which all exhibit similar transcriptional responsiveness to bacterial colonization. These 65 genes represent strong candidates for markers of the shared transcriptional response. Myd88, along with several transcription factor encoding genes known to function downstream of Myd88, are among them |
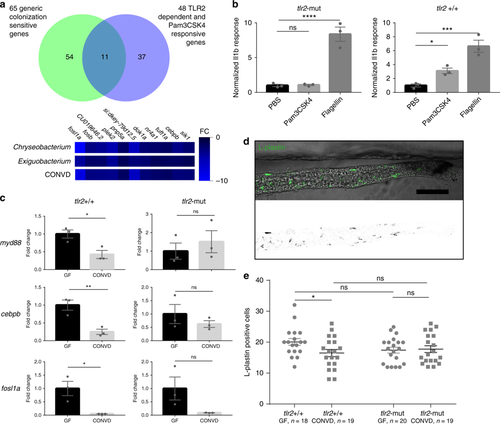
Microbiome transcriptional control of myd88 is dependent on Tlr2. a Venn diagram showing the overlap between the identities of 65 primarily suppressed transcripts displaying transcriptional sensitivity to all the different colonization modes tested in this study, and thus are strong markers of the shared transcriptional response, with 48 primarily induced transcripts displaying Tlr2 dependent transcriptional sensitivity to injection of the synthetic ligand Pam3CSK4. 11 transcripts were shared among the two sets, all of which are suppressed by colonization, but induced by Pam3CSK4 in a Tlr2 dependent manner. b Q-PCR analysis comparing the inflammatory il1b response to injection of Tlr2 ligand (PAM3CSK4), Tlr4 ligand (LPS) and control (PBS) in Tlr2-mut and Tlr2 + / + 1 h after injection. (mean ± s.e.m., n = 3 biological replicates, 10 embryos per group), *P ≤ 0.05 ***P ≤ 0.001; ****P ≤ 0.0001, by Student’s t-test. c Q-PCR analysis comparing the relative expression levels of myd88, fosl1a and cebpb, in conventionalized (CONVD) versus germ-free (GF) conditions in Tlr2 deficient mutants versus WT siblings. (mean ± s.e.m., n = 3 biological replicates, 15 embryos per group), *P ≤ 0.05; **P ≤ 0.01, by Student’s t-test. d Representative image of intestines excised from L-plastin stained embryos. Scalebar represents 100 µm. e The elevated leukocyte presence under germfree conditions in the WT siblings was not observed in Tlr2 mutants. Figure is representative of three independent replications, *P ≤ 0.05; by two-way ANOVA with Bonferroni correction for multiple comparisons, error bars represent standard error of the mean |
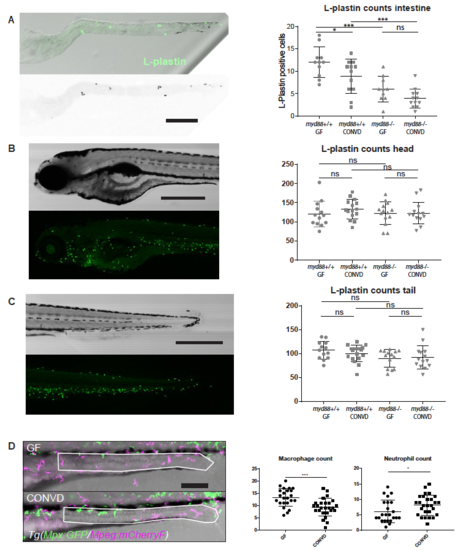
(A) Excised larval intestines conrm statistically elevated numbers of L-plastin positive cells in germ-free intestines. No signicant dierence was observed in the intestines of Myd88 decient larvae. (mean ± s.e.m, n=2 biological replicates, 6-8 embryos per group), *p0,05; ***p0,001 by two-way ANOVA with Bonferroni correction for multiple comparisons. (B-C) Whole embryo assessment of overall leukocyte assessment by L-plastin immunostaining, (mean ± s.e.m, n=2 biological replicates, 6-8 embryos per group) Acquired by confocal microscopy at 5x magnication, no signicant dierences were observed by two-way ANOVA with Bonferroni correction for multiple comparisons. (D) Quantication of macrophages (magenta) and neutrophils (green) in the distal intestine of GF versus CONVD wt larvae of the Tg(Mpx:GFP/Mpeg:mCherryF) line)at 5 DPF, acquired by confocal microscopy at 20x magnication. The region of analysis is outlined in white lines, (mean ± s.e.m, n=3 biological replicates, 6-8 embryos per group) *p0,05; ***p0,001 by Student’s t-test. Scalebars, 200 μm in A; 500 μm in B-C; 100 μm in D. PHENOTYPE:
|
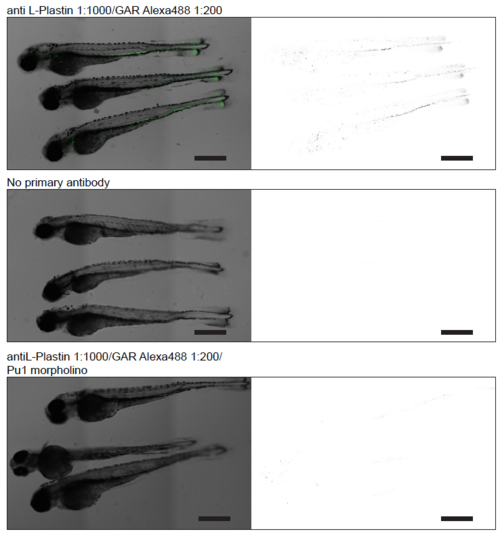
Stitched images generated from confocal stacks acquired at 10x magnification, comparing the patterns of L-plastin stain with anti L-plastin primary and goat-anti-rabbit (GAR) second-ary antibody in embryos at 3 DPF to two negative controls; either omitting the primary anti-body or by blocking leukocyte development by injection of pu.1 morpholino1. Overlay images on the left, and inverted display of the fluorescent channel on the right. Scalebar is 200 μm. |
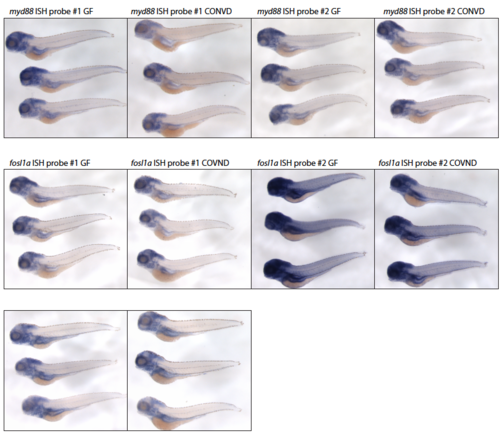
Whole-mount in situ hybridization utilizing twon non-overlapping primers targeting myd88, fosl1a and cebpb in germ-free and conventionalized 5 DPF embryos. Scalebar represents 1 mm. |
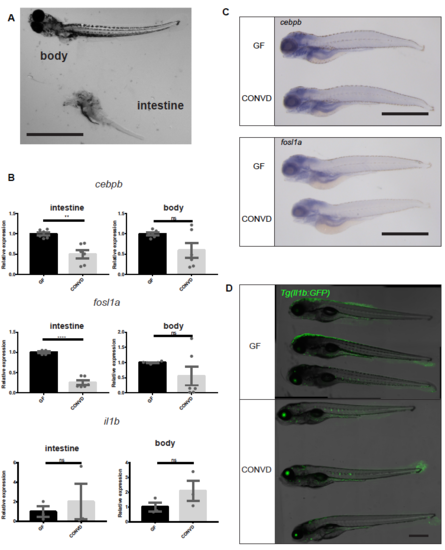
(A) Image illustrating the separation of intestinal tissues from body tissues, prior to RNA isolation and qPCR analysis of intestinal versus body (B) q-PCR analysis comparing the relative expression levels of cebpb, fosl1a and il1b, in conventionalized (CONVD) versus germ-free (GF) conditions in samples derived from excised intestinal bulp and in the remaining body tissues, (mean ± s.e.m, n=3 biological replicates, 30 embryos per group) **p0,01; ****p0,0001 by Student’s t-test (C) Wholemount in sity hybridization results of cebpb and fosl1a, scale bar represents 1 mm (D) Representative images of germ-free and conventionalized larvae in the Tg(il1b:GFP) reporter line stitched from confocal stacks acquired with 10x magnication scalebars, 500 μm in A and D; 1 mm in C. |