- Title
-
Correcting glucose-6-phosphate dehydrogenase deficiency with a small-molecule activator
- Authors
- Hwang, S., Mruk, K., Rahighi, S., Raub, A.G., Chen, C.H., Dorn, L.E., Horikoshi, N., Wakatsuki, S., Chen, J.K., Mochly-Rosen, D.
- Source
- Full text @ Nat. Commun.
|
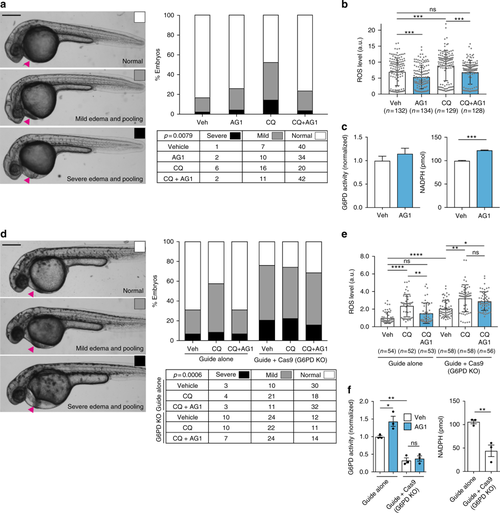
AG1 attenuates ROS-induced pericardial edema in a G6PD-dependent manner. a Embryos were treated at 24 hpf with 1 μM AG1 with and without chloroquine (CQ; 100 μg mL−1) and scored at 32 hpf. Representative phenotypic images of pericardial edema and pooling (magenta arrows) are provided on the left (scale bar: 300 μm). Embryo orientation is lateral view, anterior left. Raw counts used for chi-square analysis and calculated p value are included in table below. b ROS levels in individual WT embryos from three independent clutches. Embryos were treated at 24 hpf for 5 h before ROS measurement. Error bars represent mean ± SD (***p < 0.001, ns = not statistically significant, p > 0.99, Kruskal–Wallis multiple comparison test, adjusted p value using Dunn’s test). c G6PD activity and NADPH levels were measured using the lysates of pooled embryos (from two independent clutches). Error bars represent mean ± SEM (***p = 0.0003, two-tailed unpaired Student’s t-test). d Embryos were injected with either sgRNA targeting exon 10 of g6pd (Guide alone) or sgRNA + Cas9 protein (Guide + Cas9, G6PD KO (knockout)) to generate G6PD F0 crispants. Representative phenotypic images of pericardial edema and pooling (magenta arrows) are provided on the left (scale bar: 300 μm). Treatment conditions are the same as in a. Raw counts used for chi-square analysis and calculated p value are included in table below. e ROS levels in individual embryos with sgRNA or sgRNA + Cas9 (G6PD KO) protein injection. Treatment conditions and the statistics are the same as in b (*p = 0.0267, **p < 0.01, ****p < 0.0001, ns = not statistically significant). f G6PD activity and NADPH levels were measured with lysates of pooled embryos from three independent experiments. Error bars represent mean ± SEM of the replicate measurements (*p < 0.05, **p < 0.01, one-way ANOVA for G6PD activity measurement and two-tailed unpaired Student’s t-test for NADPH measurement). Veh: vehicle, KO: knockout, CQ: chloroquine PHENOTYPE:
|
|
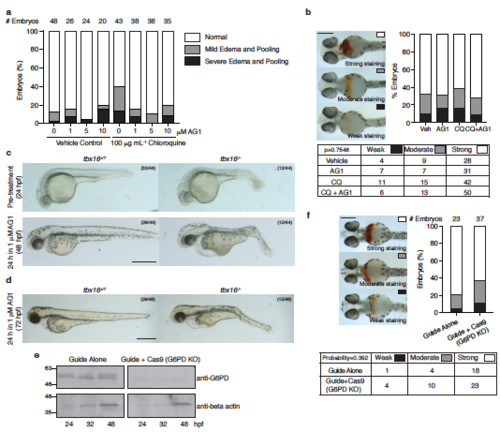
AG1 attenuates ROS-induced pericardial edema in a G6PD-dependent manner. a AG1 is not toxic to zebrafish embryos at concentrations <10 μM. Pericardial edema induced by chloroquine treatment was partially attenuated by AG1 treatment. Embryos were treated at 24 hpf with indicated concentrations of AG1 for 24 hours. Severity of pericardial edema is indicated by color schemes provided on the right of the graph. b Ventral views of whole-mount o-dianisidine staining of WT embryos at 48 hpf. Representative staining is shown on the left for embryo scoring; distribution of staining shown on the right. Raw counts used for chi-square analysis and calculated p value are included in table below. Scale bar: 300 μm. c, d Genetic loss of tbx16 function led to mesodermal defects in embryos obtained by incrossing tbx16 mutant heterozygotes. Pre-treatment at 24 hpf with 1 μM AG1 for 24 hours did not prevent pericardial edema that developed at 48 hpf in tbx16 mutants (c) nor was edema rescued at 72 hpf (d), when treated with AG1 at 48 hpf. Phenotypic ratio is indicated at the upper right corner of each image. Embryo orientation is lateral view, anterior left. Scale bar: 500 μm. e Embryos injected with sgRNA (Guide Alone) against exon 10 of g6pd and sgRNA+Cas9 protein (Guide+Cas9, G6PD KO (knockout)) were pooled at indicated times and analyzed for the G6PD protein level by Western blot. f Ventral views of whole-mount o-dianisidine staining of embryos injected with sgRNA (Guide Alone) and sgRNA+Cas9 protein (Guide+Cas9, G6PD KO) at 48 hpf. Scale bar: 300 μm. Representative staining is shown on the left for embryo scoring; distribution of staining shown on the right. Raw counts used for Fisher exact test and calculated exact probability are included in table below. Molecular weight marker is provided on the left of the blots. CQ: chloroquine; WT: wild-type; KO: knockout; hpf: hours post fertilization; Veh: vehicle. PHENOTYPE:
|


