
- Title
-
Anisotropic organization of circumferential actomyosin characterizes hematopoietic stem cells emergence in the zebrafish
- Authors
- Lancino, M., Majello, S., Herbert, S., De Chaumont, F., Tinevez, J.Y., Olivo-Marin, J.C., Herbomel, P., Schmidt, A.
- Source
- Full text @ Elife
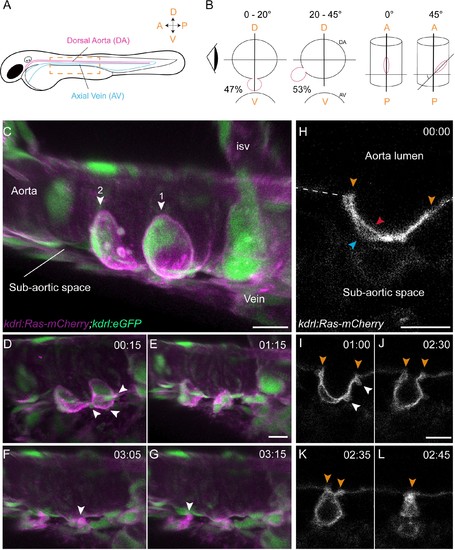
Sequential steps and morphological changes during the EHT (A–B) The EHT is variable in space and time. Schematic representations of (A) a zebrafish embryo at 48 hpf; a yellow rectangle shows the region of imaging. (B) Left, transversal sections of the dorsal aorta showing the % of cells undergoing emergence (in red) at 0°−20° or 20°–45° angle relative to the dorso-ventral axis (N = 49 cells). The eye looks in the direction of imaging. Right, top view showing variation of the angle of emergence (with the A-P axis as reference). Note that the EHT is also characterized by variability in its time-length, see Figure 1—figure supplement 1 and main text. (C–L) Live confocal images from 48 hpf Tg(kdrl:Ras-mCherry; kdrl:eGFP) embryos. (C–G) Images extracted from a 3D-rendering TL sequence (D–G) and a Z-stack acquired 120 min before initiation of the time-lapse (C), showing the typical changes of cell shape during the EHT (see Figure 1—video 1). (C) Numbered arrowheads: rim of two cup-shaped EHT undergoing cells. Arrowheads indicate blebs in (D) and cellular foots in (F and G). isv: intersegmental vessel (see also Figure 1—video 1). (H–L) Single Z-planes corresponding to cell #2 extracted from the same TL sequence. Arrowheads: cell borders connecting with adjoining endothelial cells (in yellow), the luminal membrane (in red), the basal membrane (in blue), and blebs (in white), respectively (see Figure 1—video 2). Time is indicated in hrs:min. Scale bars, 10 μm. |

The time-length of the EHT is very heterogeneous (see text also). (A) Optical sections (Z-planes) extracted from a spinning-disk confocal TL sequence performed on a 48 hpf Tg(kdrl:Ras-mCherry) embryo and showing the progression of the EHT, starting from a flat morphology (the cell is embedded in the hemogenic endothelium, top left panel), followed by the cup-shaped stage (top middle panel) and the emergence (top right panel). Bottom panels show intermediate stages. Time is indicated in hrs:min. (B) Left panel: Time taken by cells to reach the cup-shaped stage, starting from the flat-shaped stage (n = 7 cells). Right panel: Time-to-exit of EHT cells imaged starting at the cup-shaped stage and followed in the 66 TL confocal imaging sequences exploited in this study. See Materials and methods for details. (C) Optical sections (Z-planes) extracted from a spinning-disk confocal TL sequence performed on a 48 hpf Tg(fli1:Gal4;UAS:RFP) embryo, showing a cell undergoing EHT. The double-headed white arrow indicates the Antero-Posterior luminal distance (A-P luminal distance) that separates the two opposite poles of the EHT cell contacting the endothelial neighbors. Time is indicated in hrs:min. Scale bars, 10 μm. (D) Time progression of the A-P luminal distances for seven individual cells (each cell depicted by a specific color). The dotted line highlights the critical A-P luminal distance (approx. 2 μm) beyond which cells rapidly perform their exit. |
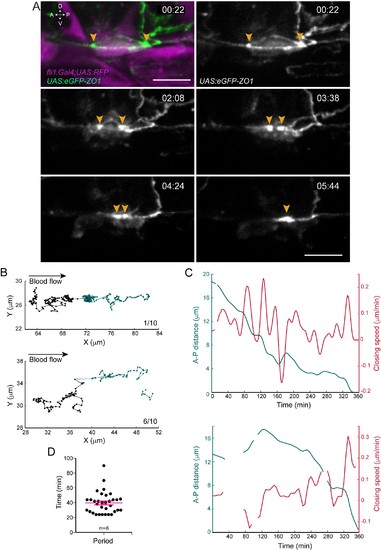
Apical constriction undergoes pulsatile activity. (A) Maximum projection of Z-planes extracted from a spinning-disk confocal TL sequence performed on a 48 hpf Tg(fli1:Gal4; UAS:RFP; UAS:eGFP-ZO1) embryo. Yellow arrowheads: regions enriched with eGFP-ZO1, at the two opposite poles of the EHT cell contacting endothelial neighbors and converging until coalescence (see Figure 2—video 1). Time is indicated in hr:min. Scale bars, 10 μm. (B–C) Spatio-temporal analysis of two cells (see also Source code 1). Top panels obtained from the cell visualized in (A) and bottom ones from a second cell. (B) Tracking of two spots delineating regions of eGFP-ZO1 densification, after maximum projection. Top and bottom panels are showing tracks of antero (black) and posterior (green) eGFP-ZO1 spots for a single cell each. X and Y correspond to the antero-posterior and dorso-ventral axis, respectively. Each point corresponds to the position in X,Y of the spot at a given time point. The lines link two successive time points. Note that when one spot is not detected, the line is interrupted. The anterior track is the longest track in 30% of cases, n = 10 (not shown); The posterior track is the longest track in 60% of cases, n = 10 (bottom panel); note that in 1/10 cells, the displacement of the antero and posterior spots were virtually equal (top panel). (C) Evolution as a function of time of distances (green) and closing speeds (red) of the two eGFP-ZO1 spots. Note that breaking of tracks and lines result from sporadic loss of signal. (D) Representation of the calculated periods of oscillatory closing speeds (39.7 min ±2.6 min). Error bars represent mean values ± SEM (n = 8 TL sequences). |
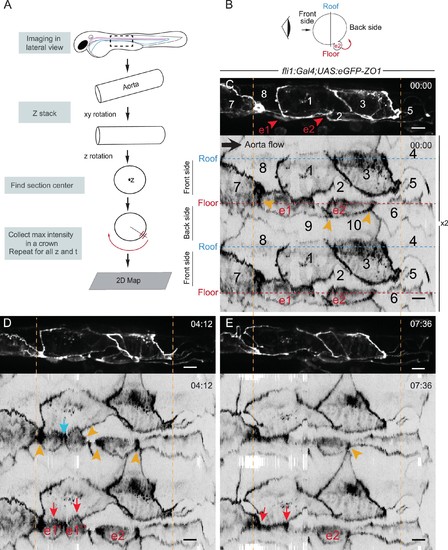
The EHT cellular landscape unravelled by 2D-projection. Schematic representations of: (A) Successive steps leading to the 2D projection (see text, Materials and methods and Source code 2), (B) The angle at which the Z-projections in the top panels (C–E) are visualized (eye) and indicating the back-sided exit of the EHT cell e2. (C–E) Top panels are maximum projections of Z-planes extracted from a spinning-disk confocal time-lapse performed on a 48 hpf Tg(fli1:Gal4; UAS:RFP; UAS:eGFP-ZO1) embryo. Bottom panels have been obtained after duplication (x2) of the corresponding 2D-maps (see Materials and methods and Figure 3—video 1). Numbers indicate individual cells. e1, e2: EHT cells (in red, with e1 dividing into e1’, e1’’ by symmetric division, panel D red arrows) are located on the aorta floor. Cells 6, 9 and 10 are exclusively on the backside. All the others span mainly the front side. Yellow arrowheads: Increased density of eGFP-ZO1 at contacting regions between EHT or endothelial cells that are oriented perpendicular to blood flow (antero-posterior axis). Blue arrow: space between the two daughter cells. Note that in panel (E), the daughter cells have emerged (red arrows). Time is indicated in hr:min. Scale bars, 10 μm. |

Intercellular contacts between hemogenic cells are reinforced. (A) Top panel: maximum projection of Z-planes extracted from a confocal TL sequence performed on a 48 hpf Tg(fli1:Gal4; UAS:RFP; UAS:eGFP-ZO1) embryo. e1; EHT cell, red arrow. Cell three localises on the back-side and partly surrounds the EHT cell (white arrow) (see also the 2D-map, bottom panel). Bottom panel: black arrows point at bicellular interfaces between endothelial cells, enriched with eGFP-ZO1 and perpendicular to the aorta flow. Blue arrows: tricellular junctions between endothelial cells. In the hemogenic region (yellow dotted rectangle), the red arrows point at tricellular junctions between potentially hemogenic cells and the EHT cell (e1, red) that are enriched with eGFP-ZO1 (see Figure 4—video 1). Scale bars, 10 μm. (B) Schematic representation of the hemogenic region in (A) emphasizing on the localization of tricellular junctions mainly between the EHT cell and a neighboring potentially hemogenic cell (e1, 2) and between two potentially hemogenic cells (2, 4). See Materials and methods for the definition of cell categories. (C) Number of cells surrounding EHT cells calculated from 2D-maps (see Materials and methods) at an early time point of the process (beginning of the TL sequence; T1, n = 6 maps), and at a late time point contemporary to emergence (T2, n = 2 maps). The green points represent values calculated from the 2 TL sequences for which emergence could be captured. Red bars, median. (D) Morphometric analysis of EHT cells at advanced cup-shaped stage, potentially hemogenic and endothelial cells calculated from 2D-maps (see also Figure 4—source data 1). Left: Size. The EHT cells advanced in the process exhibit nearly equal length (15.7 ± 1.6 μm) and width (17.0 ± 0.9 μm), potentially hemogenic cells that are elongated in the antero-posterior axis (length and width of (57.4 ± 5.2 μm) and (23.2 ± 2.5 μm)) and endothelial ones that have a larger width (length and width of (57.7 ± 2.5 μm) and (43.6 ± 2.6 μm)). Right: Area. Error bars represent mean values ± SEM. Unpaired t test (**) p<0.01; (****) p<0.0001 (n = number of maps). |
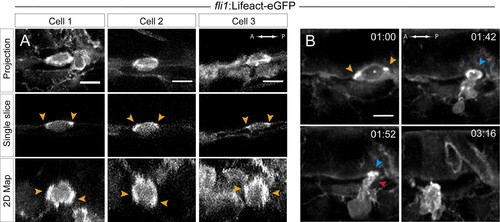
Actin localization and dynamics. (A–B) Lifeact-eGFP expressing 48 hpf embryos were imaged by spinning-disk confocal microscopy to obtain maximum projections of Z-planes (A, top and B), single Z planes (A, middle), or 2D-map projections (A, bottom; note that cells #2 and #3 are from the same aorta; see also Figure 5—source data 1). Yellow arrowheads: spots enriched with F-actin and aligned with the antero-posterior axis. (B) Images extracted from Figure 5—video 1. F-actin is enriched at the level of the contracting circumferential belt (top left) that converts into a ring (top right, blue arrowhead), and subsequently in the foot (red arrowhead). Time is indicated in hr:min. Scale bars, 10 μm. |

Blood flow influences the morphology as well as the cytoskeletal and junctional organization of hemogenic and emerging cells. Lifeact-eGFP (A,B) or eGFP-ZO1 (C) expressing 48 hpf embryos (A,B) were imaged by confocal microscopy after injection of sih or control morpholinos. (A) Transversal views of control and sih morphants show the flattening of the aorta and the decrease in perimeter when blood flow is abrogated. Yellow stars indicate the aortic lumen and the red star an EHT cell emerging from the ventral floor. (B) Maximum projections of Z-planes (top panels), single Z planes (middle panels and see Figure 6—video 1), or 2D-map projections (lower panels). Dashed yellow brackets highlight the thickness of the aorta. Yellow rectangles surround EHT undergoing cells. The same cells visualized after 2D projections are surrounded by red rectangles. Red arrowheads point at actin densification, in EHT cells, aligned with the antero-posterior axis of the dorsal aorta. (C) Maximum projections showing eGFP-ZO1 localization in two hemogenic control and sih morphants cells lying on the aortic floor. Note the mosaicism owing to transient expression of the UAS:eGFP-ZO1 transgene (for a 3D-rendering view and visualizing the aortic contours, see Figure 6—video 3). Dashed lines indicate the position of the aortic floor. Scale bars, 10 μm. |

Modeling of the EHT process. Left panels: Lifeact-eGFP expressing 48 hpf embryo imaged by spinning-disk confocal microscopy to obtain single Z planes. Images were extracted from Figure 7—video 1. Grey arrows: evidence for the deployment of pushing forces by adjoining endothelial cells. Yellow arrowheads: Lifeact-eGFP densifications. White arrowhead: extension and convergence of filopodia hypothetically emanating from an endothelial cell. Asterisk: intracellular cavity resulting from invagination of the luminal membrane. Middle and right panels (lateral views and ‘en face’ views (with the eye positioned in the aorta lumen)): schematic drawings representing five sequential steps of the EHT deduced from the localization of eGFP-ZO1 (green lines: junctional interfaces), Ras-mCherry (red and blue: luminal and basal membrane, respectively), Lifeact-eGFP (grey, F-actin circumferential belt. Note that the junctional circumferential belt is not drawn for simplicity). Grey arrows: putative pushing forces deployed by adjoining endothelial cells. Black arrow: hemodynamic force (perpendicular to the aortic plane). Note that in the ‘en face’ views, the luminal membrane should appear as a red surface (depicted by red lines only), and that the circumferential junctional and F-actin belts are only depicted at their sites of increased density, that is membrane interfaces at the A-P poles of the EHT cell, bound by tricellular junctions oriented perpendicular to blood flow, as revealed by 2D-maps. See the main text for additional comments. C1-C4: adjoining endothelial cells. Time is indicated in hr:min. Scale bar, 10 μm. |

Myosin regulatory light chains 9a and 9b are required for definitive hematopoiesis. (A) In situ hybridizations of 48 hpf embryos. Left panels, whole mount; right panel, transversal section. a, aorta; n, notochord; nt, neural tube; s, somites; v, vein; ye, yolk extension; ys, yolk sac. Results were obtained from four independent experiments. Note that for the 25/125 embryos in the top panel, the myl9a signal in the aorta was weaker and masked by the somitic staining. (B,C) Maximum projection of Z-planes obtained from 48 hpf Tg(CD41:eGFP) embryos, focusing either on the AGM region (B), or on the CHT (C). Scales bars, 50 μm (B); 100 μm (C). Only the CD41:eGFP+ cells above the yellow dashed line were counted (C), as those beneath are not necessarily hematopoietic cells (Kissa et al., 2008). (D,E) Effect of myl9a and myl9b morpholinos (e2i2 and e3i3, respectively, see Materials and methods for details and Figure 8—figure supplement 1) based knockdown on the number of CD41:eGFP+ cells in the AGM (D) and the CHT (E). Similar results, in the AGM and in the CHT, were obtained at lower quantities of morpholinos (see Figure 8—figure supplement 2). n = indicate the numbers of embryos. (B, E, F) Error bars represent mean values ± SEM. Unpaired t test (**) p<0.01; (***) p<0.001. |
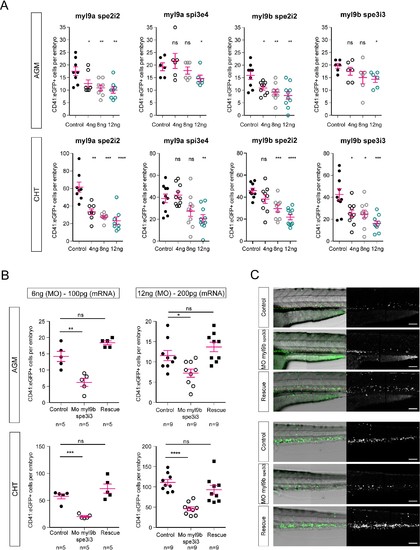
Myl9a and myl9b morpholinos phenocopy of hematopoietic phenotype and myl9b morpholino rescue. (A) CD41:eGFP positive cell numbers in the AGM (top panel) and the CHT (bottom panel) after myl9a and myl9b morpholinos at the concentrations of 4, 8 and 12 ng. (B) CD41:eGFP positive cell numbers in the AGM (top panel) and the CHT (bottom panel) after injections of 100 pg (left panel, n = 5) and 200 pg (right panel, n = 9) of myl9b mRNAs (rescue). (C) Maximum projection of Z-planes obtained from 50 hpf Tg(CD41:eGFP) embryos, focusing either on the AGM region (top panel), or on the CHT (bottom panel). Only the CD41:eGFPpositive cells above the yellow dashed line were counted (top panel), as those beneath are not necessarily hematopoietic cells (Kissa et al., 2008). Red bars represent Mean ± SEM. (*) p<0.05; (**) p<0.01; (***) p<0.001; (****) p<0.0001. |
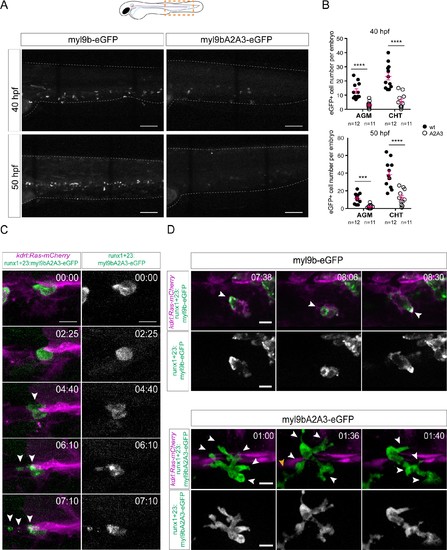
The amino-terminal phosphorylation site on Myl9b is essential for definitive hematopoiesis. (A) Maximum projection of Z-planes obtained from 40 hpf and 50 hpf embryos expressing either Myl9b-eGFP or Myl9bA2A3-eGFP under the control of the runx’1 + 23’ enhancer that allows expression in hematopoietic stem cells (see alsoFigure 9—figure supplement 1). White dotted lines delineate the embryo. Scale bars, 100 μm. (B) Quantification of the number of Myl9b-eGFP or Myl9bA2A3-eGFP positive cells in the AGM and CHT at 40 hpf or 50 hpf. Error bars represent mean values ± SEM. Unpaired t test (***) p<0.001; (****) p<0.0001 (n = 11 and n = 12 embryos; the data are representative of two independent experiments, both performed at 40 hpf and 50 hpf). (C–D) Maximum projection of Z-planes extracted from spinning-disk confocal TL sequences performed on 40 hpf Tg(kdrl:Ras-mCherry) embryos expressing the indicated forms of Myl9b-eGFP. Scale bars, 10 μm. Time is indicated in hr:min. (C) White arrowheads, cell debris resulting from bursting (see Figure 9—video 2). Similar phenotype was observed in three independent experiments. (D) White arrowheads, Myl9b-eGFP accumulation at the rear of a migrating cell (top panel) or at multiple cell extensions lacking Myl9bA2A3-eGFP accumulation (bottom panel). Similar phenotype was observed in four independent experiments. Yellow arrowhead, another migrating cell within the imaging field (see Figure 9—video 1). |

The runx’1 + 23’ enhancer allows expression of Myl9 in hematopoietic stem cells (see also text). (A) Top panels; maximum projection of Z-planes of the head, AGM and CHT (left to right) performed on a 40 hpf embryo expressing the runx’1 + 23’:eGFP transgene. Black arrows point at ectopic runx'1 +23':eGFP expression in neurons (observed in a minority of embryos), and muscle fibers. Scale bars, 50 μm. Bottom panels show trunks and tails of 40 hpf or 50 hpf embryo expressing the runx’1 + 23’:eGFP transgene in the AGM (area of HSC emergence) and in the CHT (Caudal Hematopoietic Tissue). Scale bars, 50 μm. (B) Quantification of eGFP expressing cells in the AGM or the CHT of 40 hpf embryos (n = 15 embryos; similar results were obtained at 50 hpf). Red bars represent Mean ± SEM. (C) Maximum projection of Z-planes of the CHT performed on a 48 hpf Tg(CD41:eGFP) embryo expressing the runx'1 +23':Myl9a-mKate2 transgene. Bottom panels correspond to the region highlighted by the yellow box and the white arrowheads point at eGFP (left panel), Myl9a-mKate2 (middle panel) and eGFP/Myl9a-mKate2 co-expressing cells (right panel). Scale bars, 50 μm. (D) Quantification of eGFP (%CD41+), Myl9a-mKate2 (%Runx1+) or eGFP/Myl9a-mKate2 (%CD41+Runx1+) expressing cells, according to the amount of injected DNA plasmid (n = 10 embryos). Red bars represent Mean ± SEM. |