
- Title
-
EspH is a hypervirulence factor for Mycobacterium marinum and essential for the secretion of the ESX-1 substrates EspE and EspF
- Authors
- Phan, T.H., van Leeuwen, L.M., Kuijl, C., Ummels, R., van Stempvoort, G., Rubio-Canalejas, A., Piersma, S.R., Jiménez, C.R., van der Sar, A.M., Houben, E.N.G., Bitter, W.
- Source
- Full text @ PLoS Pathog.
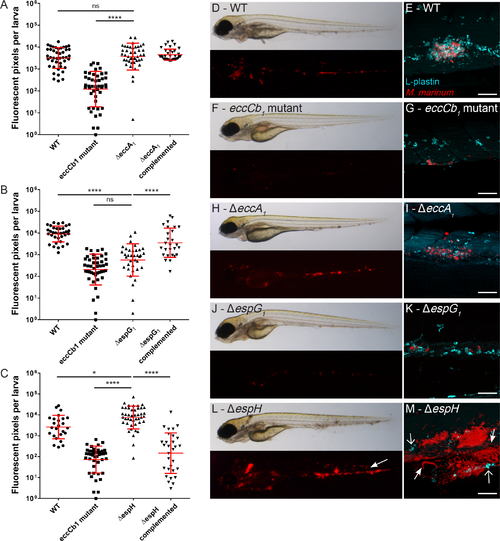
In vivo effect of ΔeccA1, ΔespG1 and ΔespH in zebrafish larvae. Graphs A-C show relative levels of infection as determined by automated pixel count software for infection of zebrafish larvae. The larvae were infected with ~75–150 CFU red fluorescent M. marinum mutant strains and analyzed at 4 dpi. Graphs show combined data of three independent biological replicates per mutant strain, each dot represents one larva. Bars represent mean and standard error of the mean. A. Systemic infection of zebrafish larvae with M. marinum ΔeccA1, B. M. marinum ΔespG1 and C. M. marinum ΔespH, * = <0.05, **** <0.001. Representative bright field and corresponding fluorescent images are depicted in: D. WT infection, F. eccCb1 mutant infection, H. M. marinum ΔeccA1, J. M. marinum ΔespG1, L. M. marinum ΔespH. Confocal imaging of a single cluster of infected L-plastin labeled phagocytic cells (cyan) in the tail of infected larvae confirmed the phenotype seen in fluorescent imaging: E. WT infection, G. eccCb1 mutant infection, I. M. marinum ΔeccA1, K. M. marinum ΔespG1, M. M. marinum ΔespH, depicting a cording phenotype (closed arrows) and intense fluorescent spots suggestive for phagocytic cell debris (open arrows). Scale bar E, G, I, K, M = 50 μm. PHENOTYPE:
|

EspH-mutant strain is hypervirulent in zebrafish larvae. A-C. Systemic M. marinum WT infection (red) of Tg(fli:GFP) larvae with green fluorescent blood vessels was followed over time, representative images are shown in A. 1dpi, B. 2dpi, C. 4dpi. Larvae were stained with anti-L-plastin to label phagocytic cells (cyan). D-F. Representative images of systemic infection with M. marinum ΔespH over time in D. 1dpi, E. 2dpi, F. 4dpi. Scale bar = 50 μm. |