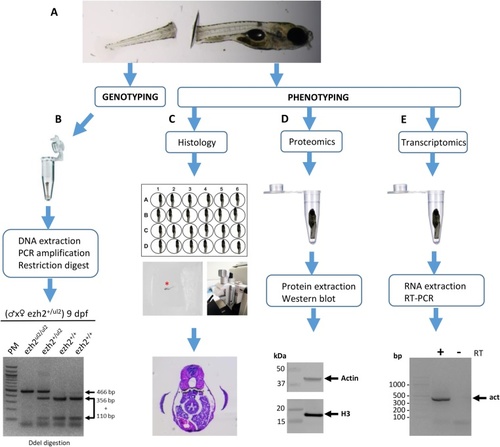
Schematic representation of the strategy for the genotypic and phenotypic analysis on single zebrafish larvae. (A) Larval tail transection. (B) DNA is extracted from the tail biopsies and genotyping is performed by RFLP assay. (C) Histological study of the anterior part of the zebrafish larvae after paraffin embedding. The red asterisk shows the zebrafish larvae in the paraffin block. (D) Protein analysis by Western blot after total protein or histone extractions from the anterior part of a single zebrafish larvae. (E) Transcript analysis by RT-PCR after RNA extraction from the anterior part of a single zebrafish larvae.
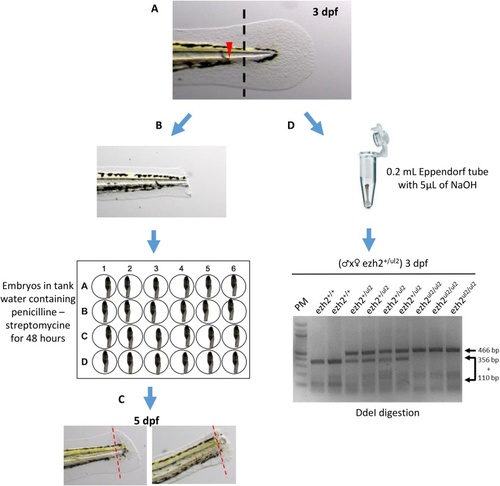
Study of caudal spinal cord regeneration. (A) Caudal spinal cord transection on zebrafish embryo at 3 dpf. The dotted line represents the site of transection and the red arrowhead highlights the limit of blood circulation. (B) Picture of the caudal part of a transected zebrafish embryo at 3 dpf. (C) Embryonic caudal region of transected zebrafish embryos at 5 dpf, 2 days post-amputation, showing complete (left) or impaired (right) spinal cord regeneration. Red dotted lines indicate the site of transection. (D) Genotyping performed by RFLP on the caudal part of the embryos after transection at 3 dpf.
Acknowledgments
This image is the copyrighted work of the attributed author or publisher, and
ZFIN has permission only to display this image to its users.
Additional permissions should be obtained from the applicable author or publisher of the image.
Full text @ MethodsX
Your Input Welcome
Thank you for submitting comments. Your input has been emailed to ZFIN curators who may contact you if
additional information is required.
Oops. Something went wrong. Please try again later.