
- Title
-
Spatial Fold Change of FGF Signaling Encodes Positional Information for Segmental Determination in Zebrafish
- Authors
- Simsek, M.F., Özbudak, E.M.
- Source
- Full text @ Cell Rep.
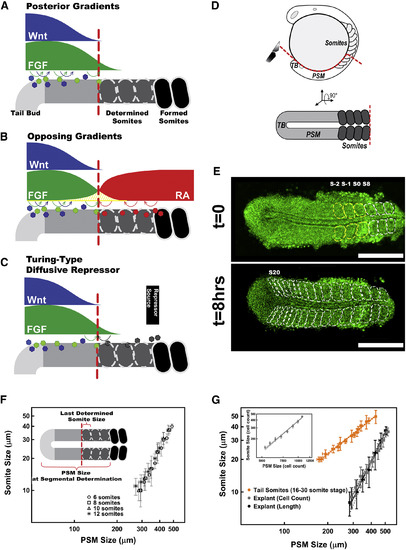
Somitogenesis and Segment Size Scaling (A–C) Current models explaining how segment sizes are determined: the classical “clock and wavefront” model (A), the “opposing gradients” model (B), and the Turing-type model (C). (D) Zebrafish embryos (top, lateral view) were cut through red line, and the explants (bottom, dorsal view) were cultured. (E) A tissue explant (from an 8 somite stage embryo) formed the 3 predetermined somites (yellow dashed lines) followed by 9 progressively smaller somites (white dashed lines) under non-elongation culture over 8 hr. A nuclear-localized GFP marker, in green, was used to count cell numbers. Scale bars, 250 μm. (F) Somite sizes display the same scaling trend (analysis of covariance [ANCOVA]: F(4,91) = 0.59, p = 0.62) with the PSM sizes in explants started at different stages (n = 6, 7, 7, and 4 for 6, 8, 10, and 12 somite stages, respectively). (G) The size of tail somites scales with the size of PSM at segmental determination in whole zebrafish embryos (orange, n = 5; reanalyzed from Gomez et al., 2008). Length measurement in 1D (black, n = 9) and cell counts in 3D (gray, n = 7). Cell counts in 3D (insert) are converted to 1D length measurements by geometry of the tissue (STAR Methods). Data are presented with error bars representing the SDs and linear fit of data in logarithmic scale with 95% confidence bands. Posterior is left. See also Figures S1 and S2. |
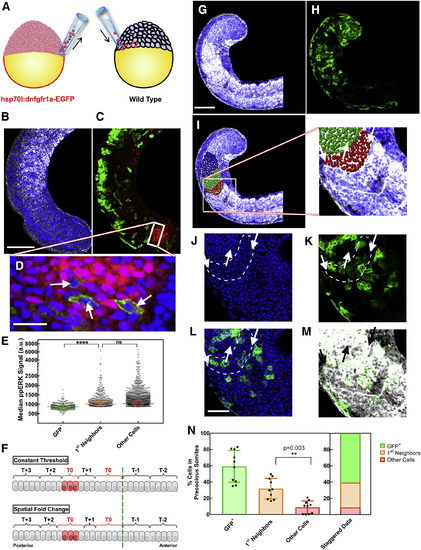
Mosaic Inhibition of FGF Signaling in the PSM of Whole Embryos Results in Formation of Precocious Somites Involving Wild-Type Cells (A) Sketch of transplantation experiment. Cells responsive to heat shock (red) are transplanted from donor embryo to wild-type host embryo (black) in mid-blastula stage, targeting a specific region. (B) Nuclear (blue) and fibronectin (white) staining of host embryo tail fixed 4 hr after heat shock. Scale bar, 100 μm. (C) Immunostaining shows GFP+ transgenic cells affected from heat shock (green) and ppERK expression as FGF signaling output in the posterior PSM (red). (D) Zoomed confocal z section image from the tail bud (posterior end of ppERK expression domain). FGF signaling dropped in GFP+ cells (arrows), whereas their wild-type neighbors were not affected. Scale bar, 20 μm. (E) Quantification of median ppERK intensity of GFP+ cells (n = 378, green) located in the posterior ppERK domain of embryos (n = 32) in comparison with their first-neighbor wild-type (orange) and the rest of the cells (red). (F) In simulations, cells are bracketed in groups as they are determined to form a somite at the end of each segmentation cycle. Heat shock is applied within the 0th cycle to only three PSM cells (20–22, red). All readout models predict determination of a precocious somite cell autonomously at the end of 0th cycle (red). Diverging from others, the SFC model predicts neighboring cells to join the precocious somite due to neighbor comparison (bottom). (G) Fibronectin (white) and nuclear (blue) staining showing formation of large and irregular somites following heat shock. Scale bar, 100 μm. (H) GFP+ cells located posterior to the determination front during heat shock trigger formation of these somites. (I) Cells within these somites were identified and color-coded with Imaris software by tracing fibronectin deposition at the boundaries. (J) Zoomed image from (G)–(I) shows spatial organization of cell nuclei at the boundaries of anterior-most precocious somite. (K) GFP+ cells are surrounded by a layer of wild-type cells in the precocious somite (arrows). (L) Overlay of (J) and (K). Scale bar, 40 μm. (M) Overlay of (K) with fibronectin staining (white). (N) Cells in precocious somites from different embryos (n = 10) were classified as GFP+ cells (green), their wild-type first neighbors (orange), and wild-type cells that are not neighboring transgenic cells. A significant wild-type neighbor contribution was observed in precocious somites (>30%). More than 90% of cells forming precocious somites were either transgenic or their first neighbors. See also Figure S8. |