
- Title
-
Adaptable, illumination patterning light sheet microscopy
- Authors
- Power, R.M., Huisken, J.
- Source
- Full text @ Sci. Rep.
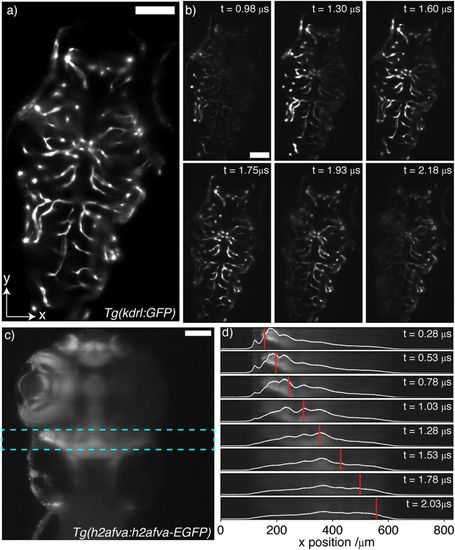
Illumination patterning in live zebrafish larvae (42% TAG amplitude). Scale bars = 100 μm. (a,b) Tg(kdrl:GFP) zebrafish (5 dpf), (c,d): Tg(h2afva:h2afva-EGFP) (5 dpf). (a) Fully illuminated plane through head and trunk section. (b) Patterning along x by phase-delayed illumination pulsing. (c) Fully illuminated plane through head and trunk section. Cyan box corresponds to ROI for (d). (d) Patterning along x by phase-delayed illumination pulsing. White line shows y-averaged illumination intensity. Red line shows position of beam focus for calibration performed in fluorescent dye solution. |
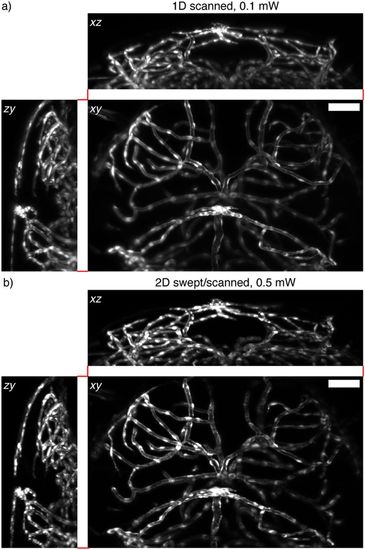
Image quality (Tg(kdrl:GFP), 5 dpf) and photobleaching (Tg(h2afva:h2afva-EGFP), 5 dpf) in zebrafish (42% TAG amplitude). All images are maximum intensity projections along the excluded axis. Scale bars = 100 μm. (a) 1D scanned mode, 0.1 mW laser power. (b) 2D swept/scanned mode, 0.5 mW laser power. |