
- Title
-
Zebrafish VCAP1X2 regulates cardiac contractility and proliferation of cardiomyocytes and epicardial cells
- Authors
- Hsieh, F.C., Lu, Y.F., Liau, I., Chen, C.C., Cheng, C.M., Hsiao, C.D., Hwang, S.L.
- Source
- Full text @ Sci. Rep.

The gene trap transgenic zebrafish was characterized as a VCAP1X2 mutant. (A) A diagram of the VCAP1X2 gene trap mutant is shown. Blue boxes indicate exons I-V. White boxes indicate 5′ and 3′ UTRs. Red arrows indicate forward (F) and reverse (R) RT-PCR primers. Yellow triangles indicate 535-bp right Tol2 arm (R) or 517-bp left Tol2 arm (L). UAS, Gal4-responsive upstream activating sequence; E1b, adenoviral E1b minimal promoter element. (B) Splicing of exon 1 and exon 2 was disrupted in VCAP1X2 mutant (mut) embryos at 24 and 48 hpf. (C) Normal morphology of VCAP1X2 mutants and WT embryos at 48 hpf. EGFP expression was detected in the heart (h), posterior cardinal vein (pcv) and primordial hindbrain channel (phbc) of VCAP1X2 mutant (n = 50 for 48 hpf). Scale bar, 25 μm. (D) Expression of EGFP and VCAP1X2 (red) is shown in heart ventricles of Tg(myl7: EGFP; myl7: H2AFZ mcherry) embryos at 96 hpf. No VCAP1X2 expression was detected in the ventricle of homozygous VCAP1X2 mutant heart (n = 15 per condition, N = 3). Scale bar, 50 μm. (E) Expression of VCAP1X2 at shield (a), 5 somite (s) (b), 18 s (c,d), 24 (e–g), 30 (h–j), 48 (k,l) and 72 (m) hpf stages. VCAP1X2 was co-expressed with myl7 in the myocardium of embryos at 24 and 30 hpf (g,j). Scale bars, 30 μm. Co-localization of VCAP1X2 and GFP was detected in phbc (n,o) and pcv (p,q) of Tg(fli1:GFP) embryos at 48 hpf (n = 10). Arrows indicate heart. a, atrium; h, heart; v, ventricle. Scale bars, 50 μm. (F) (a) VCAP1X2 (red) was expressed in the plasma membrane of ventricular myocardium cardiomyocytes labeled with EGFP in Tg(myl7:EGFP; myl7:H2AFZ mCherry) transgenic embryos at 96 hpf. (b) VCAP1X2 was not expressed in EGFP-labeled ventricular epicardium cells in Tg(tcf21:NTR; tcf21:nucEGFP) transgenic embryos at 96 hpf. (c) VCAP1X2 was also not expressed in the EGFP-labeled ventricular endocardium of Tg(fli1:GFP) transgenic embryos at 96 hpf (n = 15 per condition, N = 3). Nuclei were stained by DAPI. Scale bar, 5 μm. |

VCAP1X2 mutant displayed cardiac dysfunction and impaired cardiomyocyte proliferation. (A) Pseudodynamic reconstructed 3D images and respective bright-field images are shown of end-diastolic phase beating hearts from Tg(myl7:EGFP; myl7:H2AFZ mCherry) (a,b) or VCAP1X2 mutant (c,d) at 72 hpf. Yellow lines indicate the diameter of the ventricular chamber. Green fluorescence marks ventricular myocardium and red indicates ventricular chamber. Scale bar, 50 μm. (B) Parameters related to heart performance were measured from pseudodynamic reconstructed 3D images (a–c, n = 3, N = 2) or CCD images (d–f, n = 20, N = 3) for Tg(myl7:EGFP; myl7:H2AFZ mCherry) or WT and VCAP1X2 mutant at 72 hpf. End-systolic volume (a) and end-diastolic volume (b) were significantly increased in VCAP1X2 mutant compared with Tg(myl7:EGFP; myl7:H2AFZ mCherry) embryos. Ejection fraction (c) was lower in VCAP1X2 mutant than in Tg(myl7:EGFP; myl7:H2AFZ mCherry) embryos. End-diastolic length (d) and width (e) were increased while fractional shortening (f) was decreased in VCAP1X2 mutant compared to WT. Error bars represent standard error. Student’s t-test, **p < 0.01, ***p < 0.001. (C) Paraffin sectioning with hematoxylin and eosin staining revealed a thinner compact layer in the ventricle of VCAP1X2 mutants (b) and LacZ mRNA-injected VCAP1X2 mutants (c) compared to WT (a) or VCAP1X2 mRNA-injected VCAP1X2 mutants (d) (n = 10 per condition). a, atrium, v, ventricle. Scale bar, 50 μm. (D) Immunostaining of BrdU (red) in heart ventricles from Tg(myl7:EGFP; myl7:H2AFZ mCherry) (myl7) (a) or VCAP1X2 mutants (b) at 72 hpf. Significantly decreased cardiomyocyte (CM) number (c) and percentage of BrdU+ CMs (d) in the ventricle was detected in VCAP1X2 mutant compared to Tg(myl7:EGFP; myl7:H2AFZ mCherry) embryos (n = 20 per condition, N = 3). Student’s t-test, ***p < 0.001. Scale bar, 50 μm. Apoptotic cells were analyzed by TUNEL labeling (E) and similar low level of apoptotic cells (F) was detected in VCAP1X2 mutant and Tg(myl7:EGFP; myl7:H2AFZ mCherry) embryos (n = 15, N = 3). Cardiomyocyte nuclei stained by anti-MEF2 antibody. Error bars represent standard error. Scale bar, 50 μm. PHENOTYPE:
|
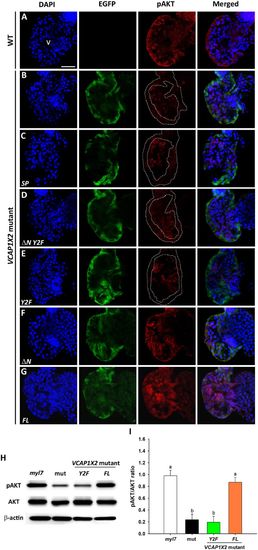
Maintenance of pAKT required expression of two tyrosines in the cytoplasmic domain of VCAP1X2. Immunofluorescent staining revealed decreased pAKT expression levels in VCAP1X2 mutants (B) compared to WT (A) at 96 hpf. pAKT expression levels in VCAP1X2 mutants could be restored by injection with ΔN (F) or FL (G) VCAP1X2 mRNA but not with SP (C), ΔN Y2F (D) or Y2F (E) VCAP1X2 mRNA (n = 15 per condition, N = 3). Nuclei were stained with DAPI. Scale bar, 30 μm. v, ventricle. Dashed lines illustrate the ventricular myocardium. Erythrocytes in the ventricular chamber show non-specific staining from secondary antibody. (H) Levels of pAKT or total AKT in embryonic hearts isolated from Tg(myl7:EGFP; myl7:H2AFZ mCherry) (myl7), VCAP1X2 mutant (mut) or VCAP1X2 mutant injected with Y2F or FL VCAP1X2 mRNA were measured by Western blot with β-actin as loading control. Cropped representative blots for each protein are shown. Uncropped blots are shown in Supplementary Fig. S4. All blotting was performed using the same experimental conditions. (I) Quantification of pAKT/AKT expression ratio among different treatments (N = 3). Error bars indicate standard error. Quantitative data were analyzed by ANOVA with Bonferroni multiple comparisons. Treatments that are not statistically different (α = 0.05) from each other are labeled with the same letter. |
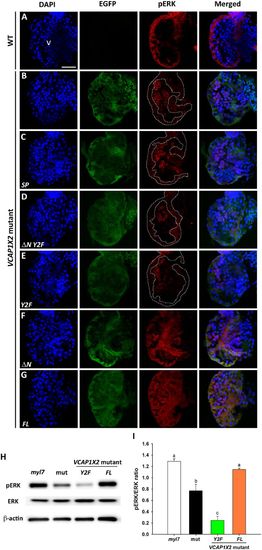
Maintenance of pERK required expression of two tyrosines in the cytoplasmic domain of VCAP1X2. Immunofluorescent staining revealed reduced pERK expression levels in VCAP1X2 mutant embryos (B) compared to WT (A) at 96 hpf. Reduced pERK expression levels in heart ventricles of VCAP1X2 mutants could be restored by injection with ΔN (F) or FL (G) VCAP1X2 mRNA but not with SP (C), ΔN Y2F (D) or Y2F (E) VCAP1X2 mRNA (n = 15 per condition, N = 3). Dashed lines illustrate the ventricular myocardium. Erythrocytes in the ventricular chamber show non-specific staining from secondary antibody. Nuclei were stained with DAPI. Scale bar, 30 μm. v, ventricle. (H) Levels of pERK or total ERK in embryonic hearts isolated from Tg(myl7:EGFP; myl7:H2AFZ mCherry) (myl7), VCAP1X2 mutant (mut) or VCAP1X2 mutant injected with Y2F or FL VCAP1X2 mRNA were measured by Western blot analyses with β-actin as loading control. Cropped representative blots for each protein are shown. Uncropped blots are shown in Supplementary Fig. S4. All blotting was performed using the same experimental conditions. (I) Quantification of pERK/ERK expression ratio among different treatments (N = 3). Error bars indicate standard error. Quantitative data were analyzed by ANOVA with Bonferroni multiple comparisons. Treatments that are not statistically different (α = 0.05) from each other are labeled with the same letter. |
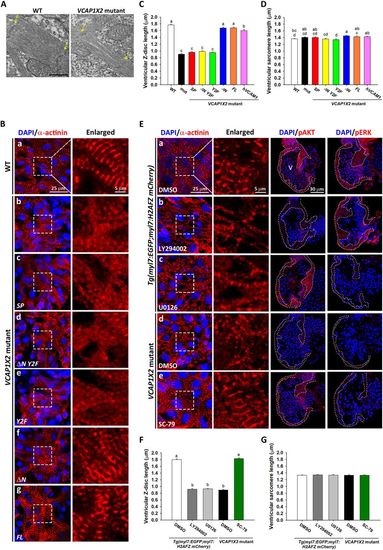
Disorganized sarcomere structure was observed in VCAP1X2 mutant hearts and rescued by VCAP1X2 variant mRNA, hVCAM1 mRNA or a PI3K activator. (A) Transmission electron microscopy shows sparse myofilaments and indistinct Z-discs in ventricular sarcomere of VCAP1X2 mutants at 96 hpf (n = 3 per condition). Arrows indicate Z-discs (Z). Scale bar, 500 nm. (B) Striated Z-discs were detected by α-actinin immunofluorescence in WT heart (a), while a dotted pattern was observed in VCAP1X2 mutants (b) at 96 hpf. ΔN (f) or FL (g), but not SP (c), ΔN Y2F (d) or Y2F (e), restored striated Z-discs (n = 16 per condition, N = 3). Z-disc length and sarcomere length were measured from immunofluorescence images. Z-disc length (C) was reduced in VCAP1X2 mutants and SP, ΔN Y2F or Y2F-injected mutants but not those injected with ΔN, FL, or hVCAM1 mRNA at 96 hpf (n = 160 per condition, N = 3). (D) Slight differences (maximum 8%) were found in sarcomere length, indicating that ventricular sarcomere length was not robustly affected by any treatment at 96 hpf. Data in (C and D) were analyzed by ANOVA with Bonferroni multiple comparisons. Treatments that are not statistically different (α = 0.05) from each other are labeled with the same letter. (E) α-actinin immunofluorescence on sarcomeres of DMSO-treated Tg(myl7:EGFP; myl7:H2AFZ mCherry) embryos (a) or PI3K activator (SC-79)-treated VCAP1X2 mutant heart (e) showed striations, while Tg(myl7:EGFP; myl7:H2AFZ mCherry) embryos treated with inhibitors of PI3K (LY294002) (b) or pMEK (U0126) (c), or DMSO-treated VCAP1X2 mutant hearts (d) showed a dotted pattern. Ventricular myocardium is outlined in right-most panels. Erythrocytes show non-specific staining from secondary antibody. (F) Z-disc length was measured in Tg(myl7:EGFP; myl7:H2AFZ mCherry) embryos and VCAP1X2 mutants treated with PI3K or pMEK inhibitor. Data were analyzed by ANOVA with Bonferroni multiple comparisons (α = 0.05). The difference between groups a and b was significant (p < 0.001). (G) Similar ventricular sarcomere length was detected in all groups (n = 200 per condition, N = 3). ANOVA indicated no significant difference among treatments (p = 0.96). Error bars indicate standard error. |
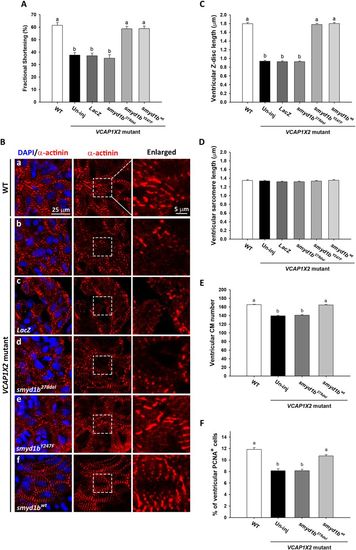
Injection of smyd1bwt but not myosin-interaction-site-absent smyd1b278del mRNA restored fractional shortening, sarcomere organization and cardiomyocyte proliferation. Injection of smyd1bwt or HMT-deficient smyd1bY247F mRNA but not smyd1b278del or LacZ mRNA restored fractional shortening. (A) (n = 24 per condition, N = 4) and Z-disc length (C) (n = 200 per condition, N = 4) at 96 hpf. Data were analyzed by ANOVA with Bonferroni multiple comparisons (α = 0.05). The difference between groups a and b was significant (p < 0.001). Similar ventricular sarcomere lengths (D) were detected in all groups (n = 200 per condition, N = 4). ANOVA indicated no significant difference among treatments (p = 0.49). (B) Striated Z-discs were detected by α-actinin immunofluorescence on sarcomeres in the ventricle of WT (a), smyd1bY247F (e) or smyd1bwt (f) mRNA-injected VCAP1X2 mutant hearts while a dotted pattern on Z-discs was observed in ventricles of VCAP1X2 mutant (b), LacZ (c) or smyd1b278del mRNA (d)-injected mutant hearts. Enlarged areas are indicated by white dashed rectangles. Nuclei were stained by DAPI. Significantly reduced cardiomyocyte number (E) or percentage of PCNA+ cardiomyocytes (F) was detected in ventricles of smyd1b278del mRNA-injected or un-injected (Un-inj) VCAP1X2 mutant hearts compared to smyd1bwt mRNA-injected or WT embryos at 96 hpf (n = 15, N = 3). Data were analyzed by ANOVA with Bonferroni multiple comparisons. Treatments that are not statistically different (α = 0.05) from each other are labeled with the same letter. Error bars indicate standard error. |
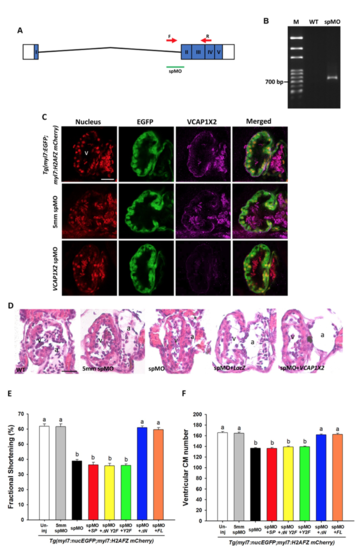
VCAP1X2 morphant embryos exhibited similar cardiac defects to VCAP1X2 mutant embryos. (A) A diagram of VCAP1X2 spMO target site at the boundary between intron 1 and exon 2 is shown. (B) Splicing of exon 1 and exon 2 was disrupted in VCAP1X2 morphant compared to wild-type (WT) embryos, indicated by the 702 bp RT-PCR product using forward and reverse primers indicated by red arrows in (A). (C) Expression of EGFP or VCAP1X2 in ventricles of hearts in Tg(myl7: EGFP; myl7: H2AFZ mcherry), 5mm spMO-injected, and VCAP1X2 spMO-injected embryos. Higher VCAP1X2 expression was detected in the heart ventricle in Tg (myl7: EGFP; myl7: H2AFZ mcherry) embryos and 5mm spMO-injected embryos. No VCAP1X2 expression was detected in the VCAP1X2 spMO-injected embryos at 96 hpf (n = 15 per condition, N = 3). v, ventricle. Scale bar, 30 μm. (D) Paraffin sections stained with hematoxylin and eosin showed thinner ventricular compact layer in VCAP1X2 spMO-injected morphants compared to un-injected wild-type (WT) or 5mm spMO-injected control embryos at 120 hpf. Such defects could be rescued by co-injection with full-length (FL) VCAP1X2 but not with LacZ mRNA (n = 10 per condition). Scale bar, 25 μm. v, ventricle, a, atrium. (E) VCAP1X2 spMO-injected Tg(myl7:EGFP; myl7:H2AFZ mCherry) embryos exhibited decreased ventricular fractional shortening in the heart compared to un-injected or 5mm spMO-injected transgenic embryos and co-injection of △N or full-length (FL) VCAP1X2 mRNA, but not SP, △N Y2F or Y2F VCAP1X2 mRNA, could rescue decreased ventricular fractional shortening in the heart of VCAP1X2 spMO-injected transgenic embryos at 72 hpf (n = 20 per condition, N = 3). Error bars indicate standard error. (F) VCAP1X2 spMO-injected Tg(myl7:EGFP; myl7:H2AFZ mCherry) embryos exhibited reduced ventricular cardiomyocyte (CM) number compared to uninjected or 5mm spMO-injected transgenic embryos at 72 hpf. The defect could be rescued by co-injection of △N or full-length (FL) VCAP1X2 mRNA, but not SP, △N Y2F or Y2F VCAP1X2 mRNA (n = 20 per condition, N = 3). Error bars indicate standard error. Quantitative data were analyzed by ANOVA with Bonferroni multiple comparisons. Treatments that are not statistically different (α = 0.05) from each other are labeled with the same letter. |
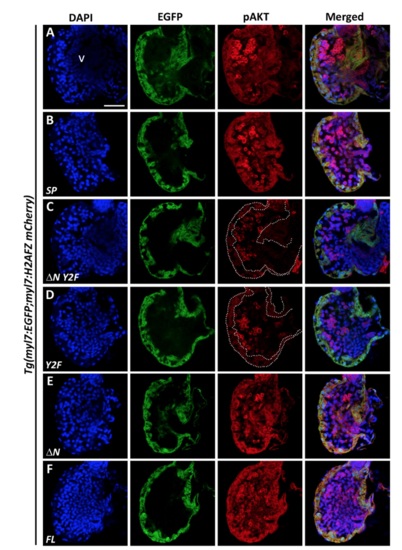
Endogenous expression of pAKT was nearly abolished in heart ventricles of △N Y2F or Y2F VCAP1X2 mRNA-overexpressing Tg(myl7:EGFP; myl7:H2AFZ mCherry) embryos. Decreased expression level of pAKT was detected in heart ventricles of Tg(myl7:EGFP; myl7:H2AFZ mCherry) embryos that overexpressed △N Y2F (C) or Y2F VCAP1X2 (D) mRNA compared to un-injected (A) or transgenic embryos that overexpressed SP (B), △N (E) or FL (F) VCAP1X2 mRNA at 96 hpf (n = 15 per condition, N = 3). Dashed lines indicate the ventricular myocardium region. Erythrocytes in the ventricular chamber show non-specific staining from secondary antibody. Nuclei were labeled by DAPI staining. v, ventricle. Scale bar, 30 μm. |
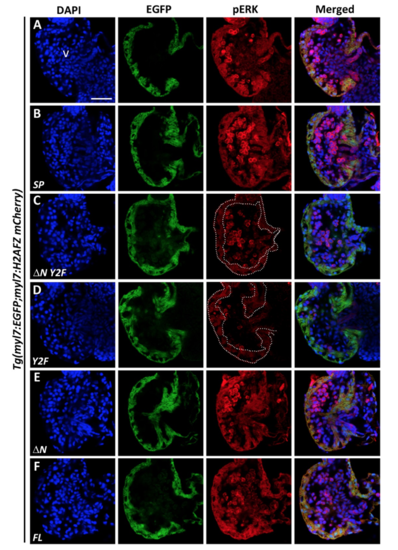
Endogenous expression of pERK was nearly abolished in heart ventricles of △N Y2F or Y2F VCAP1X2 mRNA-overexpressing Tg(myl7:EGFP; myl7:H2AFZ mCherry) embryos. Decreased expression level of pERK was detected in heart ventricles of Tg(myl7:EGFP; myl7:H2AFZ mCherry) embryos that overexpressed △N Y2F (C) or Y2F VCAP1X2 (D) mRNA compared to un-injected (A) or transgenic embryos that overexpressed SP (B), △N (E) or FL (F) VCAP1X2 mRNA at 96 hpf (n = 15 per condition, N = 3). Dashed lines indicate the ventricular myocardium region. Erythrocytes in the ventricular chamber show non-specific staining from secondary antibody. Nuclei were labeled by DAPI staining. v, ventricle. Scale bar, 30 μm. |
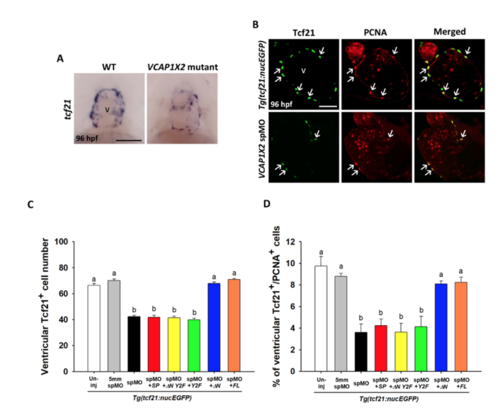
Epicardium formation was affected in VCAP1X2 mutants and morphants, but could be rescued by co-injection of △N or full-length (FL) VCAP1X2 mRNA. (A) Epicardium defects were detected by tcf21 staining in the ventricle of VCAP1X2 mutant, but not wild-type (WT) heart at 96 hpf (n = 15 per condition, N = 3). Scale bar, 50 μm. v, ventricle. (B) Tcf21+ epicardial cell number was reduced with coincident decreases in PCNA+ cell number in VCAP1X2 spMO-injected Tg(tcf21:nucEGFP) transgenic embryos compared to un-injected transgenic embryos at 96 hpf. Arrows indicate Tcf21+/PCNA+ epicardial cells. Scale bar, 25 μm. (C) Quantification of Tcf21+ epicardial cell number in ventricles of Tg(tcf21:nucEGFP) transgenic embryos was performed following different treatments (n = 20 per condition, N = 3). (D) The percentage of PCNA+ proliferative epicardial cells in ventricles of Tg(tcf21:nucEGFP) transgenic embryos following different treatments was compared (n = 20 per condition, N = 3). Error bars indicate standard error. Quantitative data were analyzed by ANOVA with Bonferroni multiple comparisons. Treatments that are not statistically different (α = 0.05) from each other are labeled with the same letter. |