
- Title
-
Directional selectivity of afferent neurons in zebrafish neuromasts is regulated by Emx2 in presynaptic hair cells
- Authors
- Ji, Y.R., Warrier, S., Jiang, T., Wu, D.K., Kindt, K.
- Source
- Full text @ Elife
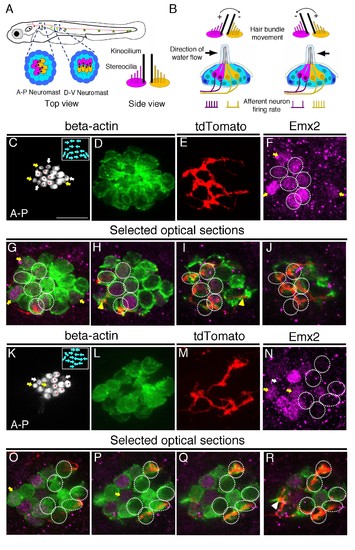
Afferent neuronal innervation is correlated with Emx2 expression and hair bundle orientation. (A) Schematic diagram of zebrafish neuromasts in the posterior lateral line showing HCs (magenta and yellow) in A-P (dark green) and D-V (light green) oriented neuromasts, which are innervated by neurons of the posterior lateral line ganglion (red). A side view of the hair bundles (kinocilium plus stereocilia) on the apical surfaces of HCs is shown. Only the posterior- or ventral-oriented HCs (magenta) are Emx2-positive. (B) Sensitivity to the direction of water flow within a neuromast is mediated by the two sets of HCs with opposite bundle orientations and their segregated neuronal innervations. (C–J) An afferent neuron (E) is associated with A > P (asterisks in (C)), Emx2-positive HCs ((F-J), circles; (H,I), yellow arrowhead) in a myo6b:actb1-GFP neuromast (C,D) that is comprised of six A > P (red asterisks), five P > A, and six immature HCs (yellow and white arrows, (C)). (G–J) Selected optical sections of (D–F). (K–R) An afferent neuron (M) contacts six Emx2-negative P > A HCs ((K), asterisks, (N-R), circles) and one immature HC ((N), white arrow; (R), arrowhead) in a myo6b:actb1-GFP neuromast that is comprised of six A > P, six P < A (red asterisks) and two pairs of immature HCs (yellow and white arrows, (K)). Yellow and white arrowheads in (I) and (R) repectively, point to nerve fibers associating with immature HCs. Total sample number for (C–J) and (K–R) = 5. Scale bar = 10 μm. EXPRESSION / LABELING:
|
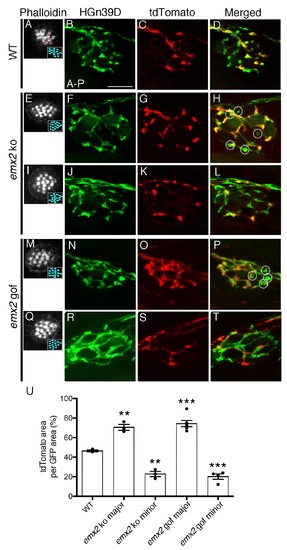
The branching pattern of a single afferent neuron in emx2 mutant neuromasts is altered. (A–D) A wildtype neuromast showing the seven A > P and eight P > A (red asterisks) HCs. All neurons are labeled green (HGn39D), while a single neuron is labeled red (neuroD:tdTomato). The fibers of the single tdTomato-positive neuron (C) overlap with a subset of the GFP-positive neurons (B) in the posterior part of neuromast (D). (E–L) Two emx2 ko neuromasts that contain only P > A HCs are shown (E,I). (E–H) The overlap between the single tdTomato-positive (G) and the GFP-positive neurons (F) in the neuromast is much broader than in wildtype (D). By contrast, the representation of tdTomato signals within the GFP-positive fibers of another emx2 ko neuromast (I–L) is less than the one in wildtype (D). (M–T) Both emx2 gof neuromasts (M, Q) show only A > P HCs, but one afferent neuron shows a broader distribution (M–P), whereas the other shows more restricted distribution of tdTomato in the neuromast (Q–T), when compared to the wildtype (D). Circles in (H,P) show fibers that are only GFP-positive. (U) Percentages of tdTomato-positive (single neuron) area per total GFP-positive (all neurons) area. The number of neuromasts: WT n = 3; emx2 ko major n = 3, minor n = 3; emx2 gof major n = 6, minor n = 4, the one-way ANOVA was used for the comparisons to WT. **p<0.01, ***p<0.001. Scale bar = 10 μm. |
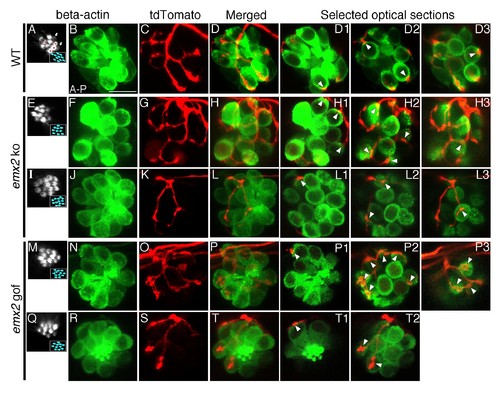
The number of HCs innervated by a single neuron is altered in emx2 mutants. (A–D3) A wildtype neuromast (A) showing five A > P, four P > A (red asterisks), and two immature HCs (white arrows). A single neuroD:tdTomato-labeled afferent neuron (C) contacts four P > A myo6b:actb1-GFP HCs (red asterisks). (D1–D3) Selected optical sections showing nerve fibers (red) contacting cell bodies (green) of HCs (white arrowheads, 4/9 HCs). (E–H3) A single afferent neuron (G) contacting eight out of ten total P > A HCs (H–H3) in an emx2 ko neuromast (arrowheads). (H1–H3) Selected optical sections of (H). (I–L3) A single labeled afferent neuron (K) contacts four out of thirteen total HCs in an emx2 ko neuromast (arrowheads). (L1–L3) Selected optical sections of (L). (M–T) A single afferent neuron (O) contacts ten out of twelve A > P Gfp-positive HCs (M,N) in an emx2 gof neuromast (arrowheads). (P1–P3) Selected optical sections of (P). (Q–T2) A single afferent neuron (S) contacts three out of eleven total A > P HCs (Q, R,T) in an emx2 gof neuromast (arrowheads). (T1–T2) Selected optical sections of (T). The number of neuromasts: WT, n = 11; emx2 ko major, n = 8, minor, n = 4; emx2 gof major n = 12, minor n = 6. Scale bar = 10 μm. |
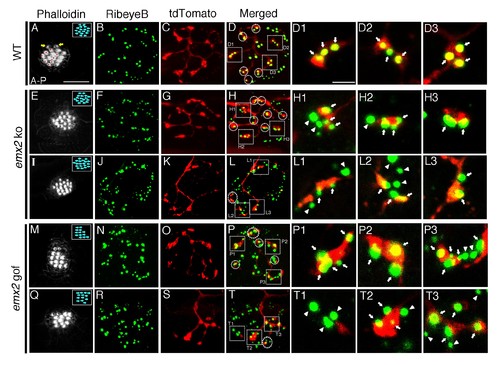
Association of single-labeled neurons with RibeyeB in emx2 mutants. (A–D) A wildtype neuromast with eight A > P (red asterisks), seven P > A, and two immature HCs (yellow arrows). (A) This neuromast shows a single neuroD:tdTomato labeled afferent neuron (C) that contacts only A > P HCs (red asterisks, A) that is stained with anti-RibeyeB antibody (B). (D) Merged labels of nerve endings and RibeyeB. (D1–D3) Expansion of square insets in (D) from selected 1 µm optical sections. (E–H3) A major neuroD:tdTomato afferent neuron (G) in an emx2 ko neuromast consisting of only P > A HCs (E) that is stained with RibeyeB antibody (F). (H) Merged labels of nerve endings and Ribeye. (H1–H3) Expansion of square insets of (H) from selected 1 µm optical sections. (I–L3) An emx2 ko neuromast (I) with a single minor neuroD:tdTomato-labeled afferent neuron (K) stained with RibeyeB antibody (J). (L) Merged labels of nerve endings and RibeyeB. (L1–L3) Expansion of square insets in (L) from selected 1 µm optical sections. (M–P3) A major afferent neuron (O) in an emx2 gof neuromast contacts only A > P HCs (M) stained wiht RibeyeB antibody (N). (P) Merged labels of nerve endings and RibeyeB. (P1–P3) Expansion of square insets in (P) from selected 1 µm optical sections. (Q–T3) A minor afferent neuron (S) in an emx2 gof neuromast that is stained with RibeyeB antibody (R). (T) Merged labels of nerve endings and RibeyeB. (T1–T3) Expansion of square insets in (T) from selected 1 µm optical sections. Squares and circles in (D,H,L,P,T) indicated all the HCs with RibeyeB label that are contacted by each fiber. White arrows and arrowheads show Ribeye puncta that are juxtaposed to labeled nerve endings or not, respectively. The number of neuromasts: WT, n = 8; emx2 ko major, n = 6, minor, n = 4; emx2 gof major n = 8, minor n = 7. Scale bar in (A) equals 10 μm and applies to all lower magnification images, and scale bar in (D1) equal 2.5 μm and applies to all higher magnification images. |
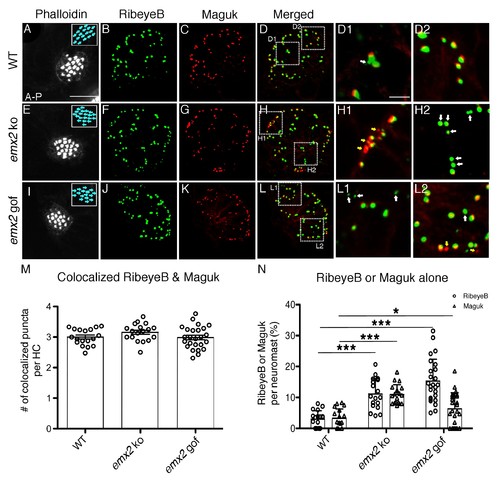
The number of RibeyeB- and Maguk-positive puncta is altered in emx2 mutant neuromasts. (A–D) A wildtype neuromast consisting of nine A > P and eight P > A HCs is stained with phalloidin (A), anti-RibeyeB (B) and anti-Maguk (C) antibodies. (D) A merged image of (B) and (C) showing co-localization of RibeyeB and Maguk. (D) A merged image of (B) and (C) showing co-localization of RibeyeB and Maguk. (D1,D2) Insets in (D) from selected optical sections showing the co-localized RibeyeB and Maguk but one has RibeyeB staining only (white arrow). (E–H2) An emx2 ko neuromast with only P > A HCs (E) is stained with anti-RibeyeB (F) and anti-Maguk (G) antibodies. (H) A merged image of (F) and (G). (H1,H2) Insets in (H) from selected optical sections showing RibeyeB (white arrows) or Maguk (yellow arrows) staining alone. (I–L2) A phalloidin-labeled emx2 gof neuromast with only A > P HCs (I) is stained with anti-RibeyeB (J) and anti-Maguk (K) antibodies. (L) A merged image of RibeyeB and Maguk. (L1,L2) Insets in (L) from selected optical sections showing staining of RibeyeB (white arrows) or Maguk (yellow arrows) alone. (M) The number of colocalized RibeyeB and Maguk puncta per HC is similar between wildtype and emx2 mutant neuromasts. (N) The percentages of single RibeyeB and Maguk puncta per neuromast are higher in emx2 mutant than wildtype neuromasts. The number of neuromasts: WT n = 18, emx2 ko n = 18, emx2 gof n = 25, obtained from three independent experiments. The one-way ANOVA was used for the comparisons shown in (M) and (N). *p<0.05, ***p<0.001. Scale bar in (A) equals10 μm and applies to all lower magnification images, and scale bar in D1 equal 2.5 μm and applies to all higher magnification images. |
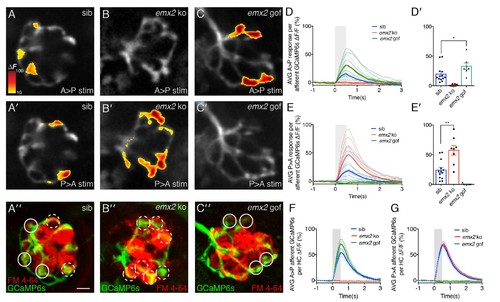
Calcium imaging in afferent process of wildtype and emx2 mutant neuromasts. (A, A’) Representative calcium signals during a A > P (A) and P > A (A’) stimulation in an individual, wildtype sibling afferent process. (B,B’) Afferent calcium signals are detected in emx2 ko mutants in response to P > A (B’), but not in response to A > P (B) stimulation. (C,C’) Afferent calcium signals are only detected in emx2 gof mutants in response to A > P (C), but not in response to P > A (C’) stimulations. (A”,B’’,C’’) The same afferent processes (green) as the panels above, except the HCs are labeled with FM 4–64 (red). (D–E’) Quantification of the mean response per afferent process in wildtype and emx2 mutants. Compared to wildtype, afferent processes in emx2 gof mutants have more signal during A > P stimulation (D, D’), and afferent processes in emx2 ko mutants during P > A stimuli (E, E’), n = a minimum of 7 neuromasts. (F,G) Quantification of the afferent calcium signals per HC. Circular ROIs in A’’, B’’ and C’ show representative ROIs used to quantify calcium signals beneath HCs. Solid and dashed circles represent afferent foci responsive in either the A > P or P > A direction, respectively. For A > P stimuli the average afferent calcium response per HC is not different between wildtype and emx2 gof (F). Similarly, for P > A stimuli, the average afferent calcium response per HC is not different between wildtype and emx2 ko (G). Calcium signals are colorized according to the ∆F heat map and superimposed onto a baseline GCaMP6s image. The number of neuromasts: WT, n = 13; emx2 ko, n = 8; emx2 gof n = 7, obtained from two independent experiments. A one-way ANOVA was used for the comparison in (D’) and (E’). A Kruskal-Wallis test was used for comparisons in (F) and (G), *p<0.05, **p<0.01. Scale bars = 5 μm. |
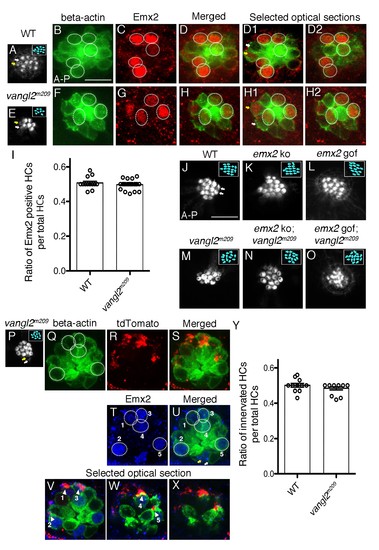
Selectivity of single-afferent neurons in vangl2m209 mutants correlates with Emx2 expression. (A–D2) A wildtype myo6b:actb1-GFP neuromast consists of five A > P, five P > A and two immature HCs (yellow and white arrows, (A,D1)), in which Emx2 expression is restricted to the five A > P (circles) and one of the immature HCs (yellow arrow, (D1)). (D) A merged image of (B) and (C), and (D1,D2) are selected optical sections of (D). (E–H2) A vangl2m209; myo6b:actb1-GFP neuromast consists of six mature and two immature HCs (yellow and white arrows) that are randomly polarized (E,F), and Emx2 is expressed in three mature (circles) and one of the immature HCs (yellow arrow, (H1)). (H) A merged image of (E) and (F), and (H1,H2) are selected optical sections of (H). (I) The percentage of Emx2-positive HCs within a neuromast is similar between wildtype and vangl2m209 mutant neuromasts. N.S. Student’s t-test. The number of neuromasts: WT, n = 10; vangl2m209, n = 22, combined results from three independent experiments. (J–O) Phalloidin-staining of neuromasts from various genotypes. (J) A wildtype neuromast containing seven A > P, seven P > A and two immature HCs (white arrows). Hair bundle orientation is random in vangl2m209 (M), emx2 ko; vangl2m209 (N), and emx2 gof; vangl2m209 (O) neuromasts. (P–X) Phalloidin (P) and GFP (Q) staining of a vangl2m209; myo6b:actb1-GFP neuromast showing random hair bundle orientation (n = 3). (R) Neuronal processes of a single neuroD:tdTomato-labeled afferent neuron contacts all five Emx2-positive HCs ((T), circles) in the neuromast (Q–X) and none of the Emx2-negative HCs. (V–X) Selected optical sections of (Q,R,T) showing the relationship between Emx2-positive HCs (blue nuclei in green HCs) and tdTomato-positive afferent processes (arrowheads). (Y) A graph showing the ratio of innervated HCs to total HCs in wildtype and vangl2m209 neuromasts. The number of neuromasts: WT, n = 11; vangl2m209, n = 13. N.S., student’s t-test. |