
- Title
-
Cell Behaviors during Closure of the Choroid Fissure in the Developing Eye
- Authors
- Gestri, G., Bazin-Lopez, N., Scholes, C., Wilson, S.W.
- Source
- Full text @ Front. Cell. Neurosci.
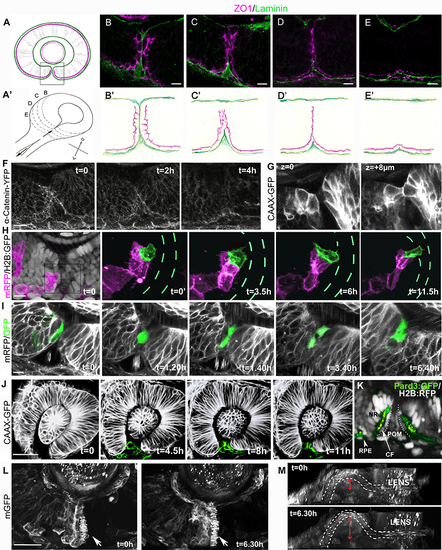
Cell organization and behavior during choroid fissure fusion. (A) Schematic showing the optic cup in parasagittal section at the level of the lens just prior to choroid fissure fusion. The cells lining the fissure margins are continuous with the retinal pigmented epithelium and approach each other with their basal surfaces (green) facing the fissure and their apical surfaces (magenta) at the sub-retinal space (ventricular lumen of the optic vesicle). Boxed region corresponds to retinal regions shown in (B–I). Dorsal is up. (A') Schematic view of the optic cup midway through choroid fissure fusion. Letters (B–E) correspond to the positions of schematics/sections in (B–E, B'–E'). (B–E) Sections through the choroid fissure during fusion showing apically-located zonula occludens labeling (ZO1; magenta) and the basal lamina component Laminin (green) in the ventral retina of a 44 hpf embryo. (B'–E') Schematic of progressive steps in choroid fissure fusion process based on analysis of eyes from 8 embryos at 44 hpf (as in B–E). (F–L) Various views of the closing choroid fissure with transgenic lines analyzed or protein derived from injected RNA indicated to the left of the panels. (F) Image stills over a 4 h period from a 10 h time-lapse movie (Movie S1) from 34 to 44 hpf of Tg(ctnna:citrine)ct3aGT labeling of α-catenin-labeled adherens junctions in the fusing choroid fissure. (G) Z-stack images at two depths of the choroid fissure showing cell shapes just prior to and at the point of fusion in a 44 hpf eye. (H) Image stills over 11.5 h from a time lapse movie (Movie S3) from 34 to 45.5 hpf showing transplanted cells expressing mRFP (magenta) in an eye in which all cells are expressing nuclear H2B-GFP (gray in t = 0); one cell located in the fissure has been pseudocolored in green and the H2B-GFP fluorescence removed from the four panels on the right. Green dashes highlight the position of the fissure (visible when viewing H2B-GFP expression). (I) Image stills over 6 h 40 m from a 12 h time lapse movie (Movie S4) from 34 to 46 hpf showing transplanted cells in the fissure expressing cytoplasmic-GFP in an eye expressing mRFP. The fissure cell divides once during the course of the movie. (J) Image stills over 11 h from a 12 h time lapse movie (Movie S5) from 26 to 38 hpf showing POM cells expressing CAAX-GFP (pseudocolored in green). (K) Image of the choroid fissure prior to fusion showing apically-located GFP-tagged Pard3 labeling (green) and nuclear staining (gray) in the ventral retina of a 40 hpf embryo. The image shows that cells lining the choroid fissure (CF) are in continuity with the retinal pigment epithelium (RPE) and the pseudo-stratified/stratified neural retina (NR). (L,M) Image stills over 6.5 h from a 12 h time lapse movie (Movie S6) from 34 to 46 hpf showing the superficial displacement of the hyaloid vessel during choroid fissure closure. The orientation in K is as other panels above; in L, the image has been rotated to give a lateral view into the fissure; the irregular spots inside the white dashed lines (outlining the hyaloid vessel) are a result of movement of blood cells. The superficial displacement of the vessel is shown by the red arrow. Scale bars: (B–I) ~10 μM; (J,K) ~30 μM. |

Cell death is not required for choroid fissure fusion. Images of whole eyes (A–B') or Z-stacks of the retina (C–C') of wildtype (left column) and NO067 mutant (right column) embryos at ages shown bottom right. Arrows show position of the choroid fissure. (A–B') TUNEL labeling (blue) of dying cells. There are more apoptotic cells in the mutant eye but they do not localize to the choroid fissure. (C–C') DAPI staining of nuclei showing the retina of the mutant eye has undergone normal morphogenesis in the absence of macrophages. Scale bar: 50 μM. |

Failure of choroid fissure fusion in eyes derived from optic vesicles with reduced POM. (A–C) Brightfield images of two host embryos at different stages after optic vesicle transplantation (at 12 ss, about 14 h pf), showing location of the ectopic eye on the yolk. Arrowheads indicate the open choroid fissure in the ectopic eyes. (D,E) Methylene blue stained sagittal sections at low (D) and high (E) resolution through an ectopic eye at 5 dpf. (F–O) Images of control (F–J) and ectopic (K–O) eyes imaged either in brightfield (F,K,I,N) or by confocal microscopy (G,H,L,M,J,O) showing cell membranes (mRFP, gray) and sox10:GFP labeled POM (green) at ages shown on the panels. Arrowheads indicate the choroid fissure. Asterisk in O' indicates retinal ganglion cell axons. The position of the lens is indicated with a white circle in (H) and (M). ee, ectopic eye; i, intestine; sc, spinal cord; y, yolk. Scale bars 50 μM. |

Optic vesicle transplantation and POM migration. (A) Schematic showing the transplant procedure. Optic vesicles (ov) from Tg(sox10:GFP)zf77 embryos injected at the 1-cell stage with RNA encoding mRFP were transplanted at between 7 and 18 somites (ss, about 12–18 hpf) under the skin above the yolk of age-matched Tg(sox10:GFP)zf77 host embryos. The location of GFP-labeled neural crest cells posterior to the eye is shown in green. (B) Timeline showing timing of optic vesicle transplantation (12–18 hpf) and fixation (>100 hpf) relative to normal choroid fissure fusion (30–56 hpf). Green arrow indicates approximate onset of neural crest migration over the eye. (C) Combined brightfield and fluorescence image stills over 5.5 h of time lapse movies (Figure S1 and data not shown) from 9 to 18 ss showing migration of the two components of the periocular mesenchyme (POM) over the optic vesicle (outlined): cranial neural crest cells (upper panels; labeled by the sox10:GFP zf77 transgene) and vascular mesodermal cells (lower panels; labeled by the fli:GFP y5 transgene). Migration of the neural crest over the eye commences at ~9 ss (left side upper panel); successful transplants discussed in this study were performed between 12 ss (middle panels) and 18 ss (right side panels). (D,E) Whole mount embryos showing expression of the prospective retinal marker rx2 in donor embryos fixed immediately post-surgery at ~12 ss. D shows one of 14/16 optic vesicles (ov) that were removed completely whereas E shows one of 2/16 transplants in which part of the vesicle was left behind; the host embryos from these two transplants were excluded from further analysis. (F,G) In order to verify that transplanted optic vesicle were not damaged by the transplant procedure, we performed control experiments in which the extirpated optic vesicle was transplanted orthotopically to its normal position and choroid fissure fusion assessed. These images shows ventral views of donor and a control host embryos from such control experiments in which an optic vesicle was transplanted back into its normal position showing that choroid fissure fusion (position marked by arrow) occurs in the transplanted orthotopic eye by 3 dpf (G, asterisk). (H) Variable amounts of transplanted neural crests, as labeled by the sox10:GFP transgene, were present in transplanted eyes. Compare control eyes with eyes transplanted with few (middle column) or more, but still reduced (right column), numbers of neural crest cells. |

Figure S2. Failure of choroid fissure fusion in eyes derived from optic vesicles with reduced POM. (A–F) Methylene blue stained sagittal sections through ectopic eyes at 5 days post-fertilization. (A) Image of a section through a wild-type eye at 72 hpf. (B,C) Low resolution images of sections through an embryo with an ectopic eye on the yolk at the level of the back of lens (B) and deeper into the back of the retina (C) and higher resolution images through the ectopic eye showing that the retina is still open at its ventral pole (D,F) where the retinal lamination and retinal pigmented epithelium (RPE) are discontinuous. However, in the deeper layers, the outer nuclear layer is continuous across the presumed position of fissure fusion (arrow in F). (D,E) Arrows in (D,E) indicate the choroid fissure. SC, spinal cord; EE, ectopic eye; RGC, retinal ganglion layer; ONL, outer nuclear layer. Scale bars 50 μM. |