
- Title
-
Vangl2/RhoA Signaling Pathway Regulates Stem Cell Self-Renewal Programs and Growth in Rhabdomyosarcoma
- Authors
- Hayes, M.N., McCarthy, K., Jin, A., Oliveira, M.L., Iyer, S., Garcia, S.P., Sindiri, S., Gryder, B., Motala, Z., Nielsen, G.P., Borg, J.P., van de Rijn, M., Malkin, D., Khan, J., Ignatius, M.S., Langenau, D.M.
- Source
- Full text @ Cell Stem Cell
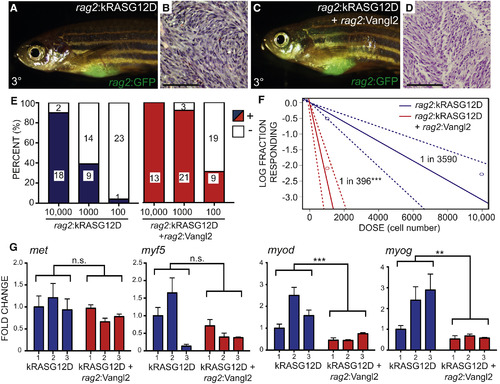
Vangl2 Elevates Tumor Propagating Cell Number 9-Fold in Zebrafish kRASG12D-Induced ERMS (A–D) Representative images of syngeneic zebrafish engrafted with 1 − 104 sorted GFP+ ERMS cells and analyzed at 30 days post transplantation. ERMS expressing rag2:kRASG12D + rag2:GFP (A and B) or rag2:kRASG12D + rag2:Vangl2 + rag2:GFP (C and D). Representative images of tumor histology (B and D). (E) Quantification of fish engrafted with 104, 103, and 102 GFP+ tumor cells that co-expressed rag2:kRASG12D with or without rag2:Vangl2 (data compiled from engraftment of 3 independent tumors/genotype). (F) Graphical analysis of extreme limiting dilution analysis (ELDA) denoting overall engraftment rates at various cell dilutions. Dotted lines represent 95% confidence intervals. Estimated tumor propagating cell number for each genotype is noted (data compiled from engraftment of 3 independent unmixed tumors/genotype). ∗∗∗p < 0.001. (G) qRT-PCR gene expression analysis performed on sorted rag2:GFP ERMS cells (independent ERMS are represented and numbered on the x axis). ∗∗p < 0.01, ∗∗∗p < 0.001; n.s., not significant, two-way ANOVA. Error bars denote SD. |
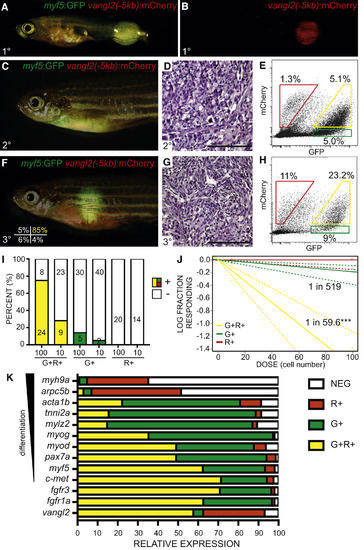
vangl2:mCherry Enriches for Self-Renewing TPCs in Zebrafish kRASG12D-Induced ERMS (A and B) Transgenic zebrafish with primary ERMS expressing vangl2(−5kb):mCherry and Tg(myf5:GFP). (C–E) Transplant fish engrafted with unsorted myf5:GFP/vangl2:mCherry ERMS shown 30 days post transplantation. Whole animal imaging (C), histology (D), and FACS of ERMS cells obtained at sacrifice (E). (F–J) Syngeneic zebrafish engrafted with purified myf5:GFP+/vangl2:mCherry+ ERMS cells. Sort purity of engrafted cells is denoted in the lower left panel of (F). Whole animal imaging (F), histology (G), and FACS of ERMS cells obtained at sacrifice (H). (I) Quantification of engraftment of myf5:GFP+/vangl2:mCherry+ (G+R+, yellow), myf5:GFP+/vangl2:mCherry− (G+, green) and myf5:GFP−/vangl2:mCherry+ (R+, red) tumor cells (data are compiled from four independent ERMS and shown as individuals in Table S3, n = 170 recipient fish total). Number of engrafted animals is denoted and percent engraftment annotated by colored bars (+). (J) Graphical analysis of extreme limiting dilution analysis (ELDA) with the fraction of TPCs found in each sorted cell fraction denoted. Dotted lines represent 95% confidence intervals. ∗∗∗p < 0.001 (data compiled from four independent tumors, as above). (K) qRT-PCR gene expression analysis performed on sorted myf5:GFP+/vangl2:mCherry+ (G+R+, yellow), myf5:GFP+/vangl2:mCherry− (G+, green), myf5:GFP−/vangl2:mCherry+ (R+, red) and myf5:GFP−/vangl2:mCherry− (NEG, white) cells. Relative expression for each gene is depicted and displayed for each subpopulation. Analysis is representative of two independent tumors (n = 2) run as technical triplicates. myf5:GFP+/vangl2:mCherry+ cells enrich for markers of ERMS TPCs including c-met, myf5, fgfr1a, and fgfr3 (p < 0.01, Student’s t test). |
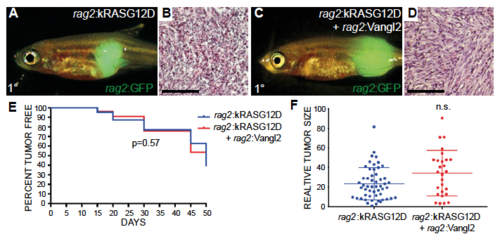
Related to Figure 5. Transgenic expression of vangl2 does not affect tumor latency, incidence, or size in the primary zebrafish ERMS. (A-D) Zebrafish ERMS generated by injection of rag2:kRASG12D (A,B) or rag2:kRASG12D + rag2:vangl2 (C,D). rag2:GFP was co-injected to fluorescently label tumor cells. Representative images of tumor histology (B,D). (E) Tumor incidence assessed over time (n=175 animals for kRASG12D and n=214 animals for kRASG12D+Vangl2, p=0.57 log-rank statistic). (F) Tumor size measured at 30 days based on GFP intensity multiplied by 2D pixel area. Each datum point represents tumor size in a single fish. Not significant by Student’s t-test calculation (n.s.). |
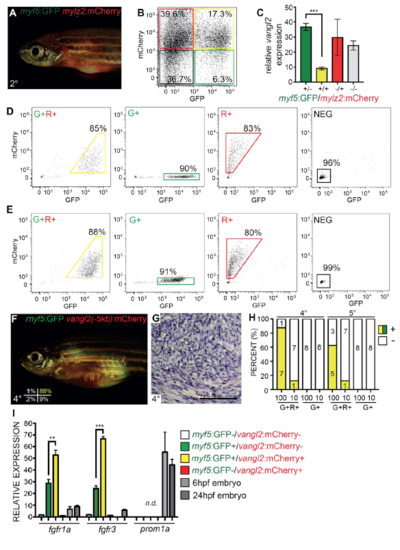
Related to Figure 6. Vangl2 transcripts are highly expressed in zebrafish TPCs, sort purity for experiments shown in Figure 6 and establishing long-term selfrenewal potential of myf5:GFP+/vangl2:mCherry+ TPCs. (A) Animal shown following engraftment of bulk myf5:GFP/mylz2:mCherry tumor cells. (B) FACS plot of isolated myf5:GFP+/mylz2:mCherry- (green), myf5:GFP+/mylz2:mCherry+ (yellow), myf5:GFP- /mylz2:mCherry+ (red) and myf5:GFP-/mylz2:mCherry- (black) ERMS cells. Percentage of cells in each gated sub-population are noted. (C) Quantitative RT-PCR analysis for vangl2 expression in sorted myf5:GFP+/mylz2:mCherry- (+/-, green), myf5:GFP+/mylz2:mCherry+ (+/+, yellow), myf5:GFP-/mylz2:mCherry+ (-/+, red) and myf5:GFP-/mylz2:mCherry- (-/-, grey) cells. Sort purity was >85% and >95% cell viability. ***p<0.001, Student’s t-test. Error bars represent standard deviation. Graph is representative of n=2 independent ERMS. (D) FACS plots showing sort purity for tumor cells engrafted into recipient animals depicted in Figure 6FJ. (E-H) Establishing long-term self-renewal potential of myf5:GFP+/vangl2:mCherry+ TPCs. Sort purity of cells isolated from fish engrafted with myf5:GFP+/vangl2:mCherry+ TPCs (E) and then engrafted into recipient fish F-H. Whole animal fluorescent image (F), histology (G), and quantification of engraftment at varying cell doses (H). myf5:GFP+/vangl2:mCherry+ (G+R+, yellow), myf5:GFP+/vangl2:mCherry- (G+, green) cells. (I) Relative expression of fgfr1a, fgfr3 and cd133/prominin1a (prom1a) in sorted myf5:GFP+/vangl2:mCherry- (G+), myf5:GFP+/vangl2:mCherry+ (G+R+), myf5:GFP-/vangl2:mCherry+ (R+), myf5:GFP- /vangl2:mCherry- (NEG) cells and compared with whole zebrafish embryos at 6 and 24 hours post fertilization (hpf). prom1a is not detected in zebrafish ERMS. Graph is representative of n=2 independent ERMS. |
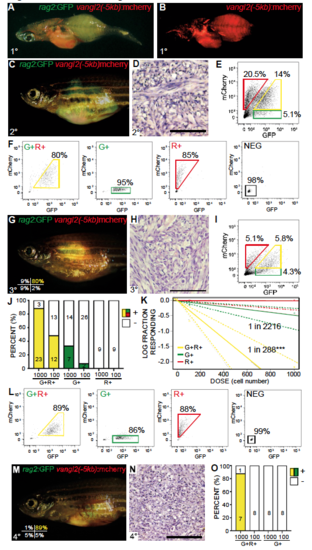
Related to Figure 6. vangl2:mCherry labels self-renewing TPCs in zebrafish ERMS. (A,B) Transgenic zebrafish with primary ERMS expressing vangl2(-5kb):mCherry along with rag2:GFP + rag2:kRASG12D. (C) Whole animal and (D) histology of syngeneic zebrafish engrafted with fluorescently-labeled ERMS imaged at 30 days post transplantation (1x10⁵ unsorted tumor cells/animal). (E) FACS of rag2:GFP/vangl2:mCherry ERMS cells isolated from the transplant fish shown in C. (F) Sort purity of cells following FACS. (G-K) Sorted cell fractions were introduced into recipient fish at limiting dilution. Whole animal (G), histology (H) and FACS analysis (I) of fish engrafted with rag2:GFP+/vangl2:mCherry+ sorted cells. Sort purity of engrafted cells shown in lower left panel G. (J) Quantification of engraftment into syngeneic recipient animals (combined results from analysis of three independent ERMS, n=118 recipient fish total). rag2:GFP+/vangl2:mCherry+ (G+R+, yellow), rag2:GFP+/vangl2:mCherry- (G+, green) and rag2:GFP-/vangl2:mCherry+ (R+, red) tumor cells. (K) Graphical analysis of Extreme Limiting Dilution Analysis (ELDA) denoting overall engraftment rates at various cell dilutions. Dotted lines represent 95% confidence intervals. Estimated tumor propagating cell number for each cell fraction is indicated. ***p<0.001. (L) Sort purity of fluorescent-labeled ERMS cells isolated from tertiary recipient fish following two rounds of FACS. (M) Fluorescent image of fish engrafted with rag2:GFP+/vangl2:mCherry+ ERMS cells, establishing long-term and serial repopulating ability of Vangl2+ TPCs. Sort purity of engrafted cells is indicated in lower left panel M (viability >96%). (N) Histology of fish shown in M. (O) Quantification of tumor engraftment by 90 days post transplantation with sorted ERMS cells, rag2:GFP+/vangl2:mCherry+ (G+R+, yellow) and rag2:GFP+/vangl2:mCherry- (G+, green) cells. |