
- Title
-
Rapid progression through the cell cycle ensures efficient migration of primordial germ cells - the role of Hsp90
- Authors
- Pfeiffer, J., Tarbashevich, K., Bandemer, J., Palm, T., Raz, E.
- Source
- Full text @ Dev. Biol.
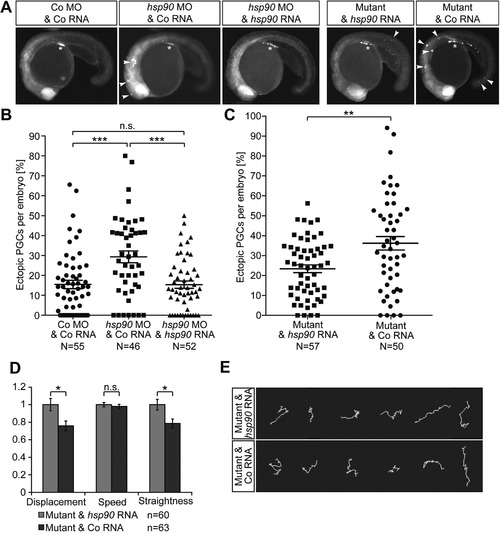
Hsp90aa1.2 function is important for the arrival of PGCs at their migration target. (A) Images of Hsp90aa1.2-knockdown embryos, hsp90aa1.2 mutants and controls. Arrowheads, ectopic PGCs. Asterisk, migration target. The PGCs are labeled with farnesylated EGFP. (B) Scatter plot presenting the quantitation of the antisense oligonucleotide knockdown experiments displayed in the three left panels in A. For the rescue, hsp90aa1.2 RNA was expressed in the PGCs by fusing the open reading frame to the 3’UTR of the nanos3 gene. Data derived from three experiments. Statistical analysis calculated using Mann-Whitney-test: Co MO&Co RNA to hsp90aa1.2 MO&Co RNA: p = 0.0002; hsp90aa1.2 MO&Co RNA to hsp90aa1.2 MO&hsp90aa1.2 RNA: p = 0.0002; Co MO&Co RNA to hsp90aa1.2 MO&hsp90aa1.2 RNA: p = 0.839. N represents the number of embryos analyzed. (C) Scatter plot presenting the quantitation of the results derived from the analysis of hsp90aa1.2 mutant embryos, injected with Control RNA or hsp90aa1.2-nanos3 3’UTR RNA expressed in the PGCs that reverses the phenotype. Data represent six independent experiments; mutant alleles used for this were four times the hsp90aa1.2d34, one time the hsp90aa1.2d5 and one time the hsp90aa1.2in1. Statistical analysis with Mann-Whitney-test resulted in p = 0.0063. N represents the number of embryos analyzed. (D) Bar graphs of migration parameters of PGCs from mutant embryos injected with Control RNA or hsp90aa1.2 RNA. The mean of the different parameters measured in mutant embryos are compared with those measured in the mutant embryos supplemented with hsp90aa1.2-nanos3 3’UTR RNA. Results derived from four experiments; two experiments carried out with the hsp90aa1.2d34 line and the other two experiments carried out with the hsp90aa1.2in1 fish line. Statistics analyzed with stratified Kruskal-Wallace-test for displacement: p = 0.03286; speed: p = 0.1323; straightness: p = 0.0215. n is the number of PGCs. (E) Representative tracks of migrating PGCs in 6–8 hpf embryos in hsp90aa1.2 mutant embryos injected with control RNA, or with hsp90aa1.2-nanos3 3’UTR RNA that reverses the phenotype. n.s. = not significant, error bars indicate SEM. PHENOTYPE:
|
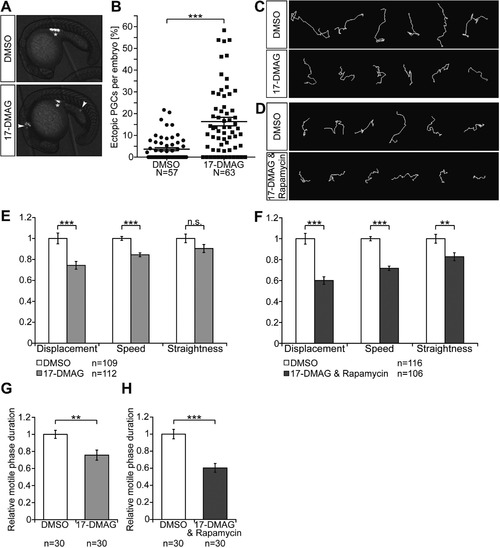
Inhibition of Hsp90 by 17-DMAG and of the mTor pathway by rapamycin interfere with PGC arrival at their target. (A) Images of 20 hpf embryos treated with DMSO as control, or with the Hsp90 inhibitor 17-DMAG. Arrowheads, ectopic PGCs. Asterisk, migration target. The PGCs express farnesylated EGFP on their membrane. (B) Scatter plot of the mean percentage of ectopic PGCs per embryo in the control and in embryos treated with the inhibitor. Data derived from three independent experiments; error bars represent SEM. Statistical analysis performed using the Mann-Whitney-test, p < 0.0001. N is the number of embryos analyzed. (C) and (D) representative 70 min tracks of migrating PGCs in 6–8 hpf embryos treated with DMSO or with 17-DMAG in C, or with 17-DMAG and rapamycin together in D. (E) and (F) Bar graphs showing quantification of dynamic migration parameters for PGCs in embryos treated with 17-DMAG in E, or with 17-DMAG and rapamycin in F. Statistical analysis performed with stratified Kruskal-Wallis-test; for E displacement: p = 0.0002925; speed: p = 2.882e−07; straightness: p = 0.1252 and for F displacement: p = 4.358e−09; speed: p ≤ 2.2e−16; straightness: p = 0.007162. n.s. = not significant. n is the number of cells analyzed. (G) and (H) Proportion of the time PGCs exhibit polar morphology and active migration in 17-DMAG in G and in the combined treatment with 17-DMAG and rapamycin in H compared with the DMSO control. Error bars represent SEM. Data derived from three independent experiments. P-value for G: p = 0.0071 and for H: p < 0.0001, with Mann-Whitney-test. n is the number of cells analyzed. PHENOTYPE:
|
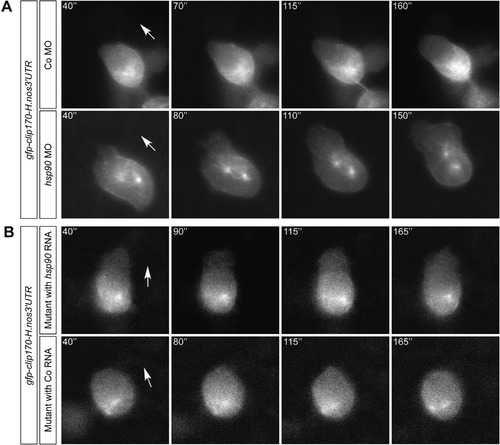
Hsp90aa1.2 function is important for microtubule organization. (A) In control PGCs, the single MTOC is positioned at the back of the migrating cell (n = 31 cells, 4 cells showing two MTOCs (13%); upper panels), while in embryos in which Hsp90aa1.2 is knocked down, a large proportion of the cells show a duplicated MTOC (n = 22 cells, 11 cells with two MTOCs (50%); lower panels). (B) In embryos mutated for hsp90aa1.2, duplicated MTOCs are found in the migrating PGCs (n = 41 cells, 22 cells with two MTOCs (52%); lower panels), a phenomenon reversed by introduction of RNA encoding for Hsp90aa1.2 in PGCs by fusing the open reading frame of the RNA to the 3’UTR of the nanos3 gene (n = 51 cells, 9 cells with two MTOCs (18%); upper panels). The experiments were performed using the hsp90aa1.2d34 and the hsp90aa1.2d5 alleles, as well as in embryos harboring both alleles. PHENOTYPE:
|
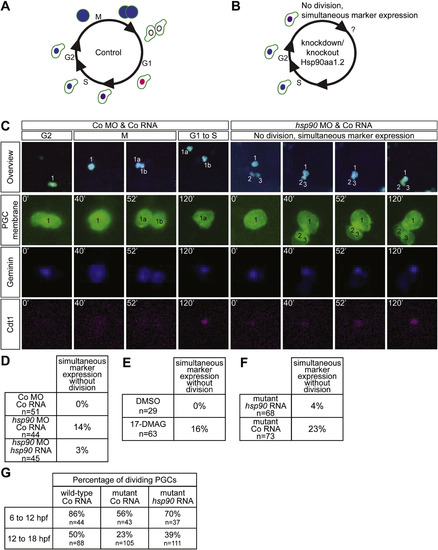
Hsp90aa1.2 function is important for cell cycle progression. (A) Schematic overview of the Fucci system. (B) Schematic representation of the Fucci system in PGCs in which Hsp90aa1.2 activity was reduced. (C) Representative images of migrating PGCs expressing the Fucci cell cycle markers in control embryos (left panels) or in embryos knocked down for Hsp90aa1.2 function (right panels). (D) Higher proportion of abnormal simultaneous expression of Geminin and Cdt1 in PGCs knocked down for Hsp90aa1.2. The effect is reversed by introduction of MO-resistant hsp90aa1.2-nanos3 3’UTR RNA. (E) 17-DMAG treatment enhances the proportion of PGCs exhibiting simultaneous expression of Geminin and Cdt1. (F) Higher proportion of abnormal simultaneous expression of Geminin and Cdt1 in PGCs within embryos carrying mutations in the hsp90aa1.2 locus (two experiments with the hsp90aa1.2d5 and one with the hsp90aa1.2d34 allele) as compared with PGCs in mutant embryos injected with wild-type hsp90aa1.2 RNA. (G) The fraction of dividing PGCs within the time frame of 6–12 hpf and of 12–18 hpf. The analysis was performed on wild-type embryos injected with control RNA, mutant embryos injected with control RNA and mutant embryos supplemented with hsp90aa1.2 RNA. The experiments were performed using the hsp90aa1.2d34 and the hsp90aa1.2d5 alleles. n is the number of PGCs analyzed. PHENOTYPE:
|
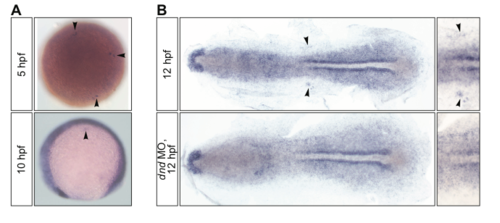
The expression pattern of hsp90aa1.2 RNA. (A) The RNA expression pattern of hsp90aa1.2 in 5 and 10 hpf old embryos. The arrowheads point at the PGCs. (B) The expression of hsp90aa1.2 in the region where PGCs are located is abolished in embryos devoid of PGCs as a result of the knockdown of Dnd (bottom panel), as compared with a control wild-type embryo at 12 hpf (upper panel). Arrowheads point at PGCs in a control wild-type embryo (right panels present a magnified view). |
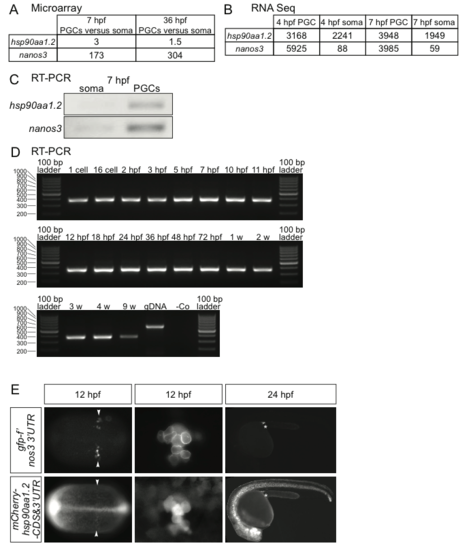
Expression of hsp90aa1.2 mRNA in PGCs and in somatic cells. (A) The relative levels of hsp90aa1.2 and nanos3 in PGCs compared with the expression level in somatic cells at 7 and 36 hpf as determined using microarray-based analysis. (B) Number of reads obtained in high throughput sequencing of sorted PGCs and somatic cells at 4 and 7 hpf (at the onset and during PGC migration respectively) for hsp90aa1.2 and nanos3 . (C) Results of RT-PCR of hsp90aa1.2 and nanos3 using cDNA from sorted 7 hpf somatic cells and PGCs. (D) RT-PCR analysis demonstrating hsp90aa1.2 mRNA expression in embryonic, juvenile and adult zebrafish stages. (E) RNA containing the 3'untranslated region of hsp90aa1.2 and the open reading frame of the gene fused to that of mCherry injected into early embryos is preferentially translated in GFP-F labeled PGCs. Magnified images of PGCs are provided in the middle panels and the positions of the PGCs are marked with arrowheads in the low magnification panels. Asterisks label the region where the gonad develops. |
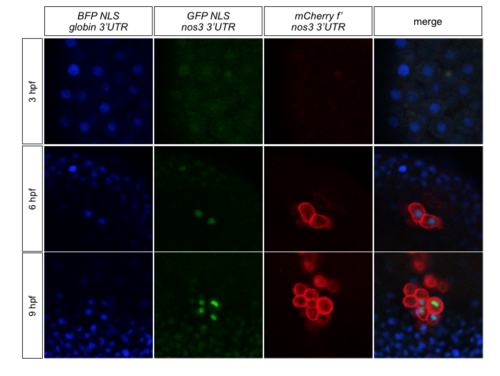
RNA containing the nanos3 3'UTR is translated preferentially in the PGCs. Transgenic embryos expressing mCherry-F on the membrane of their PGCs were injected with bfp-nls-globin3'UTR and gfp-nls-nanos3'UTR RNAs.BFP is detected in all cells from pre-MZT stages to 9 hpf, while GFP is very poorly translated prior to MZT and then is strongly expressed in the nuclei of PGCs. |
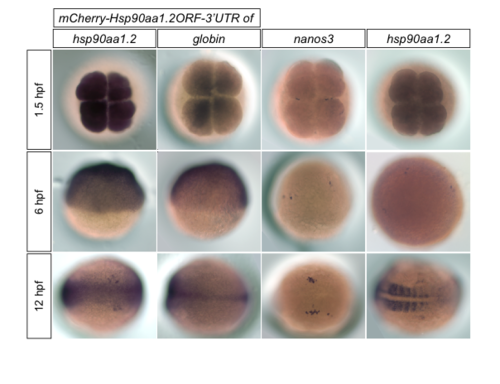
The distribution pattern of injected RNA of hsp90aa1.2 fused the open reading frame of mCherry and to its own 3'UTR or to the globin 3'UTR (two left columns) and the RNA expression pattern of nanos3 and hsp90aa1.2 (two right columns) at 1.5, 6, 12 hpf. RNA probes against the mCherry (two left columns), against the nanos3 RNA and against hsp90aa1.2 were used. |
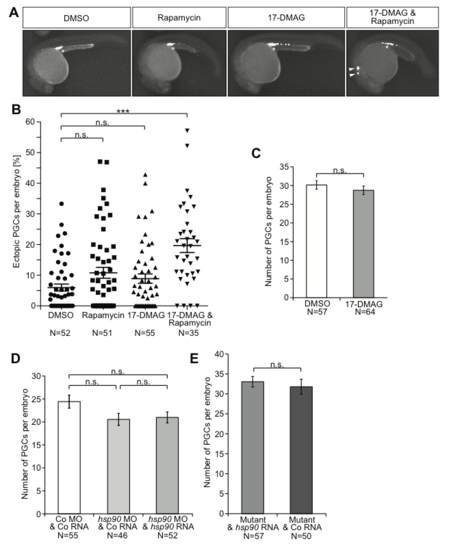
The effect of inhibition, knockdown and knockout of Hsp90 and the Tor pathway on PGC number and migration. (A) Images of embryos at 24 hpf following treatment with low levels of the different inhibitors (17-DMAG (35 µM), rapamycin (50 µM)), with ectopic PGCs indicated by arrowheads and the migration target with an asterisk. The PGCs express farnesylated EGFP on their membrane. (B) Scatter plot presenting the percentage of PGCs located in ectopic positions following treatment of embryos with low levels of the indicated inhibitors. Results derived from three experiments. All treatments were analyzed using Mann-Whitney-test to compare with DMSO (control), resulting in the following p-values: to rapamycin: p=0.1232; to 17-DMAG: p=0.1729; to 17-DMAG and rapamycin combined: p <0.0001. N is the number of embryos analyzed. (C) The average number of PGCs in 24 hpf embryos treated with either DMSO or 50 µM 17-DMAG. The results are derived from three experiments, the p-value was calculated using t-test with p=0.3802. N is the number of embryos analyzed. n.s.=not significant, error bars indicate SEM (D) The average number of PGCs per embryo at 24 hpf is not affected by manipulating the level of the Hsp90aa1.2 protein. The data is derived from three experiments and statistical analysis with t-test shows no significant difference; control to knockdown: p=0.0872; control to rescue: p=0.0879; knockdown to rescue: p=0.9238. N is the number of embryos analyzed. (E) The number of PGCs is not affected by the lack of Hsp90aa1.2 in mutant embryos as compared with mutant embryos supplemented with wild-type hsp90aa1.2. Mutant alleles used in this experiment were four times the hsp90aa1.2d34, one time the hsp90aa1.2d5 and one time the hsp90aa1.2in1. Significance level calculated using t-test: p=0.5790. N is the number of embryos analyzed. |
Reprinted from Developmental Biology, 436(2), Pfeiffer, J., Tarbashevich, K., Bandemer, J., Palm, T., Raz, E., Rapid progression through the cell cycle ensures efficient migration of primordial germ cells - the role of Hsp90, 84-93, Copyright (2018) with permission from Elsevier. Full text @ Dev. Biol.