
- Title
-
Terminal Nerve GnRH3 Neurons Mediate Slow Avoidance of Carbon Dioxide in Larval Zebrafish
- Authors
- Koide, T., Yabuki, Y., Yoshihara, Y.
- Source
- Full text @ Cell Rep.

CO2 Evokes a Slow Avoidance Behavior in Larval Zebrafish (A) Schematic illustration of the experimental setup. (B and C) Avoidance response is evoked by CO2, but not by other chemical stimuli. Vehicle control (black, n = 6), low CO2 (60–80 mg/L, pink, n = 24), middle CO2 (170–250 mg/L, orange, n = 24), high CO2 (700–780 mg/L, red, n = 20), HCl (blue, n = 10), skin extract (gray, n = 11), and taurocholic acid (yellow, n = 13). (B) Avoidance latencies after the stimulus onset. The cutoff time was set to 15 s (dotted line), and the avoidance latency of non-responded fish was scored as 15 s in statistical analysis. Wilcoxon signed-rank sum test for comparisons between vehicle and CO2 stimulations. ∗p < 0.05, ∗∗p < 0.01, and ∗∗∗p < 0.001. (C) Avoidance probabilities upon the application of various chemicals. Open, light-shaded, and dark-shaded bars represent percentages of fish that showed an avoidance response within 5, 10, and 15 s after the stimulus onset, respectively. (D) Top: representative time-lapse images of CO2-evoked avoidance behavior. Still images were taken from a movie at 10 frames/s. The asterisk represents the time point of avoidance onset (time 0). The first image was taken at the time of CO2 presentation (4,200 ms before the avoidance onset). Scale bar, 1 mm. Middle: time-extended images of an initial turn in the CO2-evoked avoidance behavior. Still images were taken from the same movie at 250 frames/s. Bottom: representative fast-start escape behavior in response to a touch stimulus onto the left head. Still images were taken from a movie at 250 frames/s. (E) Avoidance trajectories of larval zebrafish elicited by CO2 (left) and touch (right). Arrows indicate the stimulus positions. Individual fish trajectories are color coded (n = 6). (F) Quantification of avoidance kinematics in response to CO2 (red) and touch (green). Left: avoidance directionality (in degrees). Middle: change in heading angle (in degrees). Right: swim velocity (in millimeters per second). Boxplots show median, quartiles (box), and range (whiskers) (n = 6 each). Paired t test; ∗p < 0.05. See also Figure S1 and Movies S1, S2, S3, S4, and S5. |
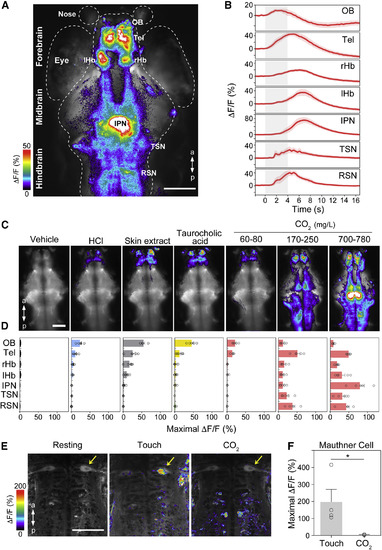
CO2 Activates Ensembles of Neurons in Larval Zebrafish (A) Representative example of the maximal intensity projection of the Ca2+ increase from wide-field Ca2+ imaging upon CO2 stimulation in Tg(Huc:Gal4;UAS:GCaMP5) fish. OB, olfactory bulb; Tel, telencephalon; rHb, right habenula; lHb, left habenula; IPN, interpeduncular nucleus; TSNs, trigeminal sensory nuclei; RSNs, reticulospinal neurons. White dotted lines outline brain, eye, and nose. Scale bar, 100 μm. (B) Temporal dynamics of GCaMP5 fluorescence (ΔF/F) evoked by CO2 in individual brain areas. Mean ΔF/F (solid line) and SEM (transparency) (n = 8). Gray-shaded areas indicate the period of CO2 application (4 s). (C) Representative examples of wide-field Ca2+ imaging from a single fish stimulated with vehicle control, HCl (1 mM), skin extract, taurocholic acid (1 mM), and CO2 (60–80, 170–250, and 700–780 mg/L). Scale bar, 100 μm. (D) Bar graphs showing the maximal ΔF/F evoked by chemical stimuli in various brain regions. Vehicle control (black), HCl (blue), skin extract (gray), taurocholic acid (yellow), and CO2 (red). Values represent mean ± SEM (n = 5). (E) Representative examples of two-photon Ca2+ imaging in the Mauthner cells from a single fish before (left) or after (middle) touch stimulation and CO2 stimulation (right, 700–780 mg/L) in Tg(Huc:Gal4;hspGFF62A;UAS:G-CaMP7) fish. Scale bar, 100 μm. Arrows indicate the right Mauthner cell. (F) Bar graph showing the maximal ΔF/F evoked by touch and CO2 stimuli in the Mauthner cells. Values represent mean ± SEM (n = 4). Unpaired t test; ∗p < 0.05. See also Figure S2 and Movie S6. |

Nasal and Trigeminal Ablation Diminishes CO2-Evoked Avoidance Behavior (A–C) Dorsal (A and B) and lateral (C) fluorescence views of Tg(Huc:Gal4;UAS:GCaMP5) zebrafish larvae before (left) and after (right) nasal (A), OB (B), and trigeminal ganglion (gV) (C) ablation. Dotted lines mark the locations of the nose (A), OB (B), and trigeminal ganglion (C), in which GCaMP5 fluorescence is no longer apparent after the ablations. Scale bars, 100 μm. (D and E) Effects of nasal, OB, and trigeminal ganglion ablations on CO2-evoked Ca2+ responses. (D) Dorsal views of intact, nasal-, OB-, and trigeminal ganglion-ablated Tg(Huc:Gal4;UAS:GCaMP5) zebrafish larvae. Scale bar, 100 μm. (E) Bar graphs showing the maximal ΔF/F evoked by CO2 in various brain regions in intact (red, n = 6), nasal-ablated (orange, n = 6), OB-ablated (purple, n = 6), and trigeminal ganglion-ablated (green, n = 5) zebrafish. Values represent mean ± SEM. (F and G) CO2-evoked avoidance response in intact (red, n = 24), nasal-ablated (orange, n = 9), OB-ablated (purple, n = 11), and trigeminal ganglion-ablated (green, n = 10) zebrafish. A high concentration of CO2 (700–780 mg/L) was used in this experiment. (F) Avoidance latencies after the CO2 stimulation onset. Wilcoxon signed-rank sum test for comparisons between intact and ablated fish. ∗∗∗p < 0.001. (G) Avoidance probability upon application of CO2. Open, light-shaded, and dark-shaded bars represent the percentages of fish that showed avoidance responses within 5, 10, and 15 s after the stimulus onset, respectively. See also Figure S3. |

CO2 Activates the Trigeminal Pathway (A) Dorsolateral view of Tg(Gal4s1102t;UAS:gapGFP) zebrafish larva expressing membrane-tethered GFP in the trigeminal ganglion (gV) neurons and their axons. GFP expression is also observed in other peripheral neurons, including the vagal ganglion (gX). Scale bar, 100 μm. (B) Lateral view of Tg(Gal4s1102t;UAS:G-CaMP7) zebrafish larvae expressing G-CaMP7 in the trigeminal ganglion and gX. Scale bar, 100 μm. (C) Representative image of the calcium increase in trigeminal ganglion neurons after CO2 application. The gX did not respond to CO2. Scale bar, 100 μm. (D) Temporal dynamics of G-CaMP7 fluorescence (ΔF/F) in the trigeminal ganglion and gX upon application of CO2 to the nose. Mean ΔF/F (solid line) and SEM (transparency) (n = 6). Gray-shaded areas indicate the period of CO2 application (4 s). (E) Bar graphs showing the maximal ΔF/F evoked by various chemical stimuli in the trigeminal ganglion and gX. Values represent mean ± SEM (n = 6). (F) Temporal dynamics of G-CaMP7 fluorescence (ΔF/F) in the trigeminal ganglion upon the application of different concentrations of CO2. Mean ΔF/F (solid line) and SEM (transparency) (n = 6). Low CO2 (60–80 mg/L, green), middle CO2 (170–250 mg/L, blue), and high CO2 (700–780 mg/L, red). Gray-shaded areas indicate the period of CO2 application (4 s). (G) Elimination of the CO2-evoked trigeminal ganglion activation by nasal ablation. Left: representative images of G-CaMP7 fluorescence changes in response to CO2 before (top) and after (bottom) nasal ablation. Scale bar, 50 μm. Right: bar graph showing the CO2-evoked maximal ΔF/F before (top) and after (bottom) the nasal ablation. Values represent mean ± SEM (n = 3). Paired t test; ∗p < 0.05. See also Figure S4. |
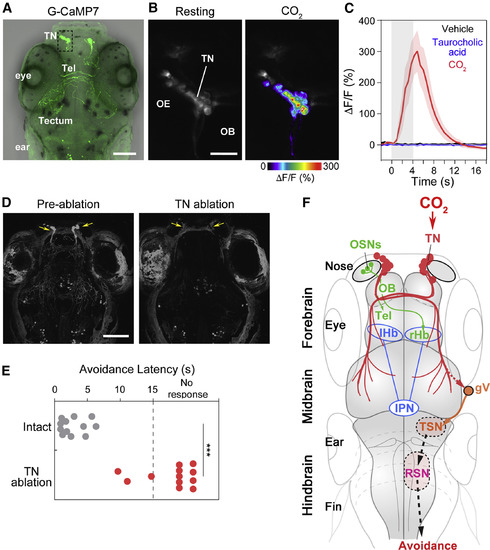
GnRH-Expressing Terminal Nerve Is a CO2 Sensor for Avoidance Behavior (A) Dorsal view of Tg(GnRH3:GFF;UAS:G-CaMP7) zebrafish larva expressing G-CaMP7 in the terminal nerve (TN). Dotted rectangle marks the location of the terminal nerve shown in (B). Scale bar, 100 μm. (B) Left: resting-state fluorescence in the terminal nerve. Right: calcium increase in the terminal nerve after CO2 application. Scale bar, 20 μm. (C) Temporal profiles of G-CaMP7 fluorescence (ΔF/F) in the terminal nerve upon application of vehicle (black), taurocholic acid (blue), and CO2 (red) to the nose. Mean ΔF/F (solid line) and SEM (transparency) (n = 4). Gray-shaded areas indicate the period of CO2 application (4 s). (D) Dorsal fluorescence views of Tg(GnRH3:GFF;UAS:GFP) zebrafish larvae before (left) and after (right) the laser ablation of terminal nerve. Arrows indicate the location of the terminal nerve. (E) CO2-evoked avoidance response in intact (gray, n = 12) and terminal nerve-ablated (red, n = 12) zebrafish after exposure to a high concentration of CO2 (700–780 mg/L). Wilcoxon signed rank sum test for comparisons between intact fish and terminal nerve-ablated fish. ∗∗∗p < 0.001. (F) Schematic model summarizing the neural circuit mechanism underlying the CO2-evoked avoidance behavior in larval zebrafish. CO2 activates four distinct neural pathways: terminal nerve (red), trigeminal (orange), olfactory (green), and habenulo-interpeduncular (blue). The terminal nerve-trigeminal pathway (nose → terminal nerve → trigeminal ganglion → trigeminal sensory nucleus [TSN] → reticulospinal neurons [RSNs]) contributes to the emergence of the slow avoidance response. |