
- Title
-
Landmark detection in 2D bioimages for geometric morphometrics: a multi-resolution tree-based approach
- Authors
- Vandaele, R., Aceto, J., Muller, M., Péronnet, F., Debat, V., Wang, C.W., Huang, C.T., Jodogne, S., Martinive, P., Geurts, P., Marée, R.
- Source
- Full text @ Sci. Rep.

Sample image and corresponding landmarks for each dataset. CEPHA (left) with 19 landmarks, DROSO (top right) with 15 landmarks and ZEBRA (bottom right) with 25 landmarks. |
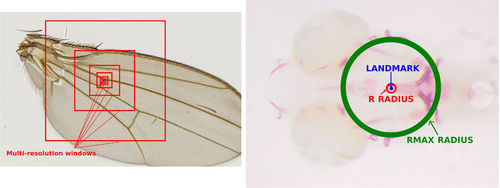
On the left, illustration of multi-resolution features representing one pixel (on the DROSO dataset, with D = 6 windows). The corresponding described pixel is located at the center of the windows (in blue). On the right, illustration of R and R max radius (on the ZEBRA dataset). Observations in the R radius are considered as landmarks (positive) for the classification approach. At training, PπR2 non-landmark observations are extracted in the [R, R max ] radius. |

In red, the position of landmark 8 as observed in all the images of the ZEBRA dataset, overlaid on an image. In blue, the position of the corresponding 30,000 examples extracted during prediction according to our sampling strategy. In yellow, the real landmark position. |
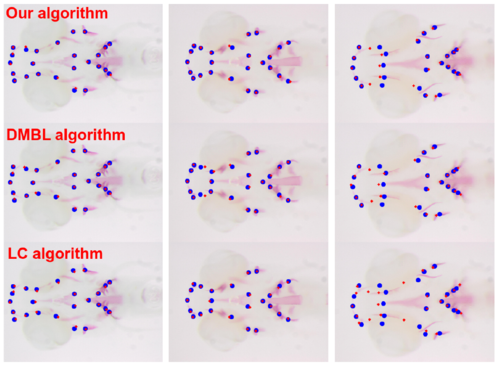
Examples of detection on the ZEBRA dataset. Ground truth landmarks are in blue, and the detection in red. The 3 images were chosen according to their deformations (smallest, median and maximal deformation) |