
- Title
-
Visualizing Multiciliated Cells in the Zebrafish Through a Combined Protocol of Whole Mount Fluorescent In Situ Hybridization and Immunofluorescence
- Authors
- Marra, A.N., Ulrich, M., White, A., Springer, M., Wingert, R.A.
- Source
- Full text @ J. Vis. Exp.

Schematic of experimental flowchart. This flowchart shows an experimental workflow, accompanied by illustrations of critical stages in which the snowflake indicates cold incubation, the three curved lines represent heat, and the clock represents long incubation times. The workflow can be performed in a minimum of 6 days (see day number in upper right corner of each stage in the process), though some steps can be performed over longer time periods, as noted in the protocol. A detailed depiction of the mounting process is drawn out, demonstrating the final mounted embryo tail between the glass slide and coverslip. A black dashed box outlines the area that is imaged at 60X magnification. |
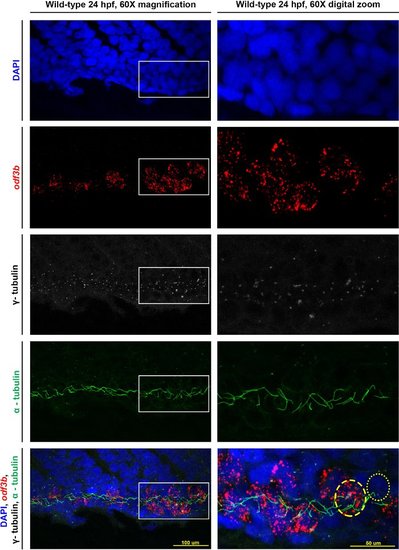
Representative results for visualizing MCCs of the zebrafish pronephros. Maximum image projections of a 24 hpf wild-type zebrafish embryo at 60X magnification as well as a digital zoom on the confocal at 60X magnification of the same embryo. The white boxes indicate the area focused on for the zoom. Individual stains of DAPI (nuclei), odf3b (MCCs), γ-tubulin (basal bodies), and α-tubulin (cilia) are labeled and then merged together in the bottom two panels. In the digital zoom, we provide approximations of the cell locations as follows: an MCC is outlined by the dashed yellow circle, and the dotted yellow circle outlines a mono-ciliated cell. |