- Title
-
A high-resolution mRNA expression time course of embryonic development in zebrafish
- Authors
- White, R.J., Collins, J.E., Sealy, I.M., Wali, N., Dooley, C.M., Digby, Z., Stemple, D.L., Murphy, D.N., Billis, K., Hourlier, T., Füllgrabe, A., Davis, M.P., Enright, A.J., Busch-Nentwich, E.M.
- Source
- Full text @ Elife
|
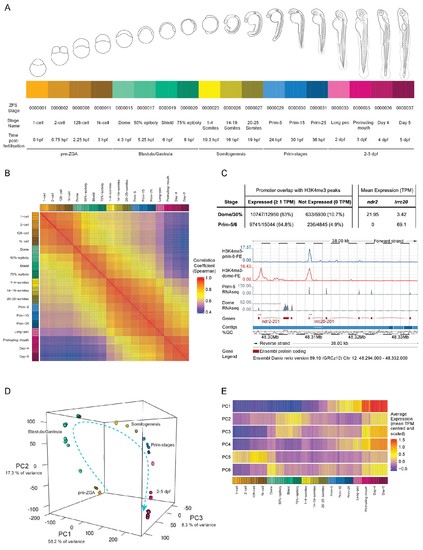
A transcriptional map of development. (A) Stages represented in this study. The colour scheme is used throughout the figures. Also shown are the ZFS stage IDs, stage names and approximate hours post-fertilisation (at 28.5°C) for each stage and five developmental categories. (B) Sample correlation matrix of Spearman correlation coefficients of every sample compared to every other sample. (C) Example of the overlap between H3K4me3 signal and genes. Ensembl screenshot of the region occupied by ndr2 and lrcc20 (the direction of transcription is indicated by arrows). Included tracks are: H3K4me3-prim-6-FE (blue) – fold enrichment of H3K4me3 ChIP-seq (H3K4me3/control) at prim-6 stage, H3K4me3-dome-FE (red) – fold enrichment of H3K4me3 ChIP-seq (H3K4me3/control) at dome/30% epiboly, Prim-5 RNAseq and Dome RNAseq (grey) – alignments of RNA-seq reads. The table above shows the genome-wide overlap between H3K4me3 ChIP-seq peaks and the promoters of expressed/not expressed genes as well as the average expression (TPM) of each gene at each stage. ndr2 is expressed only at dome stage and displays a peak only in the dome/30% epiboly H3K4me3 ChIP-seq. lccr20 is expressed at both stages and has a H3K4me3 peak at both stages. (D) 3D plot of Principal Component Analysis (PCA) showing the first three principal components (PCs), which together explain 83.8% of the variance in the data. Samples from the same stage cluster together and there is a smooth progression through developmental time (shown as dashed arrow). Samples are coloured as in (A) and are annotated with the stage categories. The amount of variance explained by each PC is indicated on each axis. (E) Representation of the expression profiles that contribute most to the first 6 PCs. The expression values are centred and scaled for each gene for the 100 genes that contribute most to that PC and then the mean value for each sample is plotted. |
|
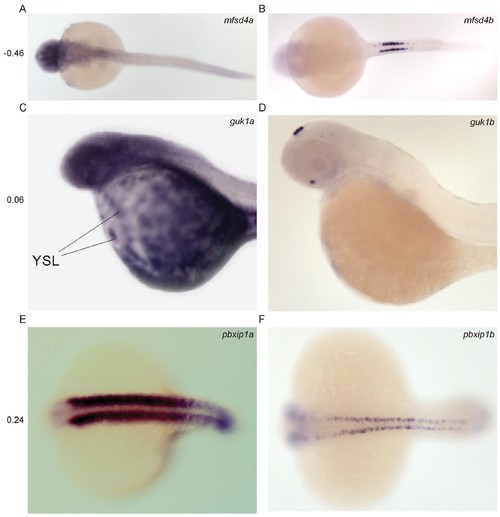
Divergent expression of paralogous pairs. Images from ZFIN (ZFIN.org) of examples of paralogous gene pairs with diverged expression patterns. The Pearson correlation coefficient between the RNA-seq expression profiles of each pair is shown to the left. (A–B) mfsd4a (ENSDARG00000023768, ZDB-IMAGE-041130–790) and mfsd4b (ENSDARG00000008263, ZDB-IMAGE-060810–3118). (C–D) guk1a (ENSDARG00000030340, ZDB-IMAGE-020816–64) and guk1b (ENSDARG00000005776, ZDB-IMAGE-060216–46). (E–F) pbxip1a (ENSDARG00000071015, ZDB-IMAGE-020919–1927) and pbxip1b (ENSDARG00000011824, ZDB-IMAGE-050208–1397). |


