
- Title
-
Zebrafish aversive taste co-receptor is expressed in both chemo- and mechanosensory cells and plays a role in lateral line development
- Authors
- Mojib, N., Xu, J., Bartolek, Z., Imhoff, B., McCarty, N.A., Shin, C.H., Kubanek, J.
- Source
- Full text @ Sci. Rep.
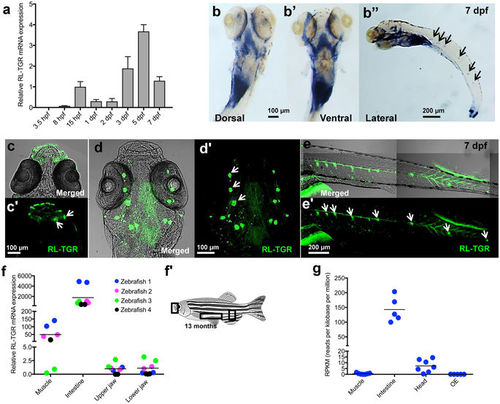
Expression of RL-TGR in zebrafish. (a) RT-qPCR analysis of rltgr in the early developmental stages of zebrafish, 3.5 hours post fertilization (hpf) to 7 days post fertilization (dpf). Gene expression was normalized to that of 18 S rRNA and presented as fold changes (mean ± SD) against 15 hpf expression. rltgr transcripts, which were detected by RT-qPCR analysis of whole embryos, begin to express from 8 hpf stage onwards. (b-b”) Whole mount in situ hybridization (WISH) showing the expression of rltgr at 7 dpf (dorsal, ventral, and lateral view, respectively). At 7 dpf, rltgr is expressed in both lateral as well as posterior part of pharyngeal region and intestine (b-b’, dorsal and ventral view, anterior to the top). Additionally, rltgr is expressed in the neuromasts of the lateral line system (black arrows, b”, lateral view, anterior to the left). (c–e’) Immunostaining of RL-TGR at 7 dpf in wild type embryos. RL-TGR-positive cells were detected (c-c’, dorsal view, anterior to the top) in the lips and neuromasts (white arrows) of the mouth region, (d-d’, ventral view, anterior to the top) neuromasts (white arrows) of the cephalic lateral line, and (e-e’, lateral view, anterior to the left) neuromasts (white arrows) of the posterior lateral line system. (f) Tissue specific expression of rltgr in adult zebrafish by RT-qPCR. Gene expression was normalized to that of 18 S rRNA and presented as fold changes (mean ± SD) against expression in muscle (4 biological replicates). The horizontal lines show median values. Corresponding to WISH results, the highest expression of rltgr was observed in the intestine followed by expression in muscles and mouth (upper and lower jaw). (f’) Image of adult zebrafish marking tissues analyzed for RT-qPCR in (f), adapted from Wikipedia commons32 with the license https://creativecommons.org/licenses/by/3.0/deed.en) (changed to grayscale). (g) Expression of rltgr in RNA Sequencing data of different tissues from independent studies available in short read archive database (SRA-NCBI). Read counts were normalized across the libraries for comparison. rltgr expression was observed in intestine, muscle, head and olfactory epithelium (OE). The different tissues of adult zebrafish harvested for total RNA extraction are depicted as a schematic diagram. (c–e’) are confocal single-plane images. n > 20 embryos; scale bars are shown in individual images. EXPRESSION / LABELING:
|
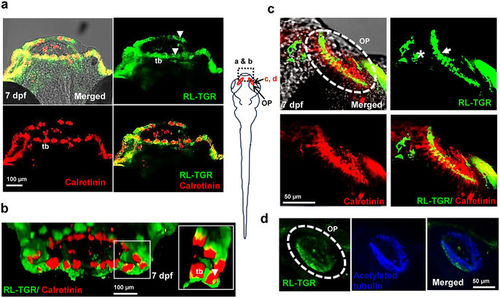
RL-TGR is expressed in the lip epithelium, taste buds, and olfactory epithelium. (a) Confocal images of the mouths of wild type embryos (dorsal view, anterior to the top) at 7 dpf stained with RL-TGR (green; expression in the epithelial layer of both upper and lower lip indicated by white arrowheads, basal cells and apical microvilli of the taste buds marked as ‘tb’) and taste bud marker calretinin (red, expression in labial taste buds, also marked as ‘tb’). (b) 3-D confocal images of the lips of 7 dpf wild type embryos (anterior of the lip facing outward) stained with RL-TGR (green) and calretinin (red). RL-TGR-positive cells were detected in the lip epithelium, basal cells, and apical microvilli (white arrowheads in the zoomed in inset) of taste buds (tb). (c) Confocal images of olfactory pit (OP) of wild type embryos (dorsal view, anterior to the top) stained with RL-TGR (green; expression in the sensory epithelium of the olfactory pit outlined by white dotted circles) and calretinin (red, expression in the olfactory receptor neurons of the olfactory epithelium). (d) Confocal images of olfactory pit (OP) of wild type embryos (dorsal view, anterior to the top) stained with RL-TGR (green; expression in the sensory epithelium of the olfactory pit outlined by white dotted circles) and acetylated tubulin (blue, expression in the cilia of the olfactory epithelium). n > 20 embryos; schematic diagram of the 7 dpf larvae shows the location at 7 dpf of different images; the scale bars are shown in individual images. EXPRESSION / LABELING:
|
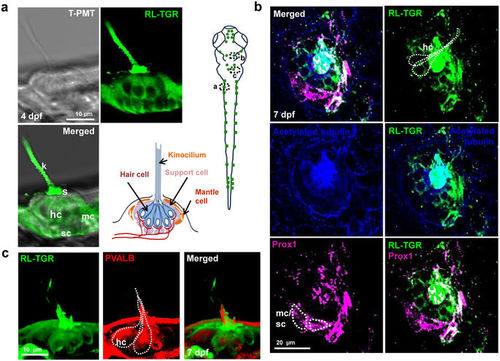
RL-TGR is expressed in the neuromasts. (a) Confocal images of a single neuromast of the posterior lateral line system of wild type embryo at 4 dpf (lateral view). RL-TGR (green) staining signal was detected in hair cells (hc), support cells (sc), and mantle cells (mc) of the neuromast. The image on the bottom right represents the scheme of a neuromast illustrating different cells and their organization (modified after Ghysen and Dambly-Chaudiere, Current Opinion in Neurobiology, 2004)33. (b) Confocal images of a neuromast of wild type embryo (dorso-lateral view) at 7 dpf stained with RL-TGR (green, expression in the hair cells), acetylated tubulin (blue, expression in the cilia of the hair cells), and neuromast marker Prox1 (magenta, expression in the hair cells, supporting cells, and mantle cells). Colocalization of RL-TGR and acetylated tubulin suggests that RL-TGR is highly expressed in both kinocilia and cell bodies of the mechanosensory hair cells. RL-TGR colocalized with Prox1 in the stereocilia of the hair cells and supporting cells surrounding the neuromast. (c) 3D maximum intensity projection images of a neuromast of wild type embryo (lateral view) at 7 dpf stained with RL-TGR (green, expression in the hair cells), parvalbumin (PVALB) (red, expression in the hair cells). n > 50 embryos; schematic diagram of the 7 dpf larvae shows the location of different images; scale bars are shown in the images. |
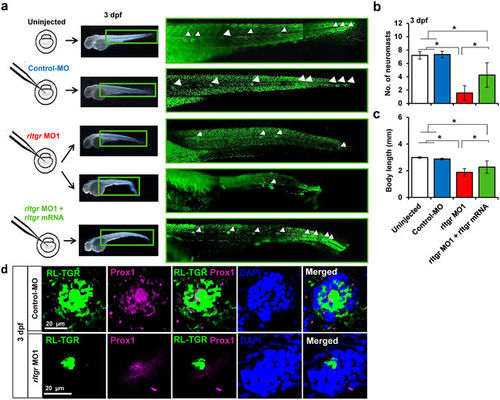
RL-TGR is involved in lateral line development. (a) Scheme showing injections of control MO, rltgr MO1 and rltgr mRNA in 1-2 cell stage embryos. At 3 dpf, the neuromasts were assessed (white arrowheads) in the respective injected populations by observing the embryos stained with SYTOX green nucleic acid stain. There was a decrease in the number of neuromasts in the rltgr morphants and the number was restored upon co-injection with rltgr mRNA (b). The bar graph shows that rescue in context with the number of neuromasts was significant (*P value < 0.0001; n = 15–16). (c) The body length of the injected populations is shown as a bar graph. Note a significant restoration of body length of rltgr morphants when co injected with rltgr mRNA (*P value < 0.0001; n = 35–66). (d) Confocal images of a single neuromast from 3 dpf control embryos and rltgr morphants (dorsal view) stained with RL-TGR (green) and neuromast marker Prox1 (magenta). DAPI stains nuclei (blue). n > 20; scale bars are shown in the images. EXPRESSION / LABELING:
PHENOTYPE:
|
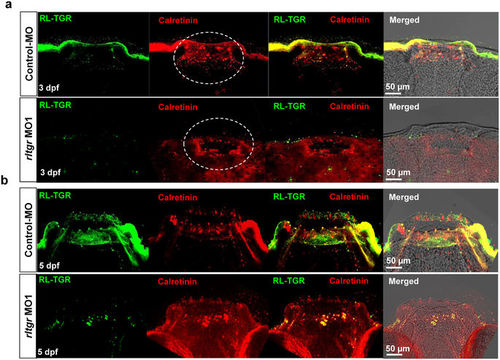
RL-TGR has a minimal effect on taste bud development. (a) Confocal images of the mouths of control embryos and rltgr morphants (dorsal view, anterior to the top) at 3 dpf stained with RL-TGR (green) and the taste bud marker calretinin (red). (b) Confocal images of mouth of control embryos and rltgr morphants (dorsal view, anterior to the top) at 5 dpf stained with RL-TGR (green) and taste bud marker calretinin (red). n > 10; scale bars are shown in the images. PHENOTYPE:
|
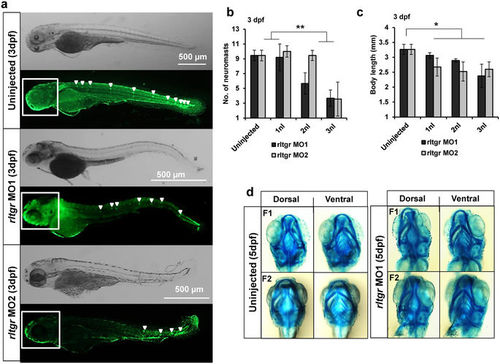
Demonstration of RL-TGR MOs specificity. (a) Brightfield and fluorescence representative images from uninjected, rltgr MO1, and rltgr MO2 injected embryos population at 3 dpf. The neuromasts were assessed (white arrowheads) in the respective injected populations by observing the embryos stained with SYTOX green nucleic acid stain. There was a decrease in the number of neuromasts in the rltgr morphants (both MO1 and MO2) as compared to uninjected embryo. (b) Quantitative assessment of the neuromasts shows that there was significant decrease in the number of neuromasts in both rltgr MO1 and MO2 injected populations (**P value <0.0001; n = 10–12). (c) Measurement of the body length shows that there was significant reduction in both rltgr MO1 and MO2 injected populations as compared to uninjected ones (*P value < 0.01; n = 26–30). (d) Brightfield images of 5dpf embryo heads stained with alcian blue cartilage stain to assess cartilage development (F1 = fish #1; F2 = fish #2). No delay in the cartilage development was observed in the morphants when compared to uninjected ones. n > 10; scale bars are shown in the images. PHENOTYPE:
|
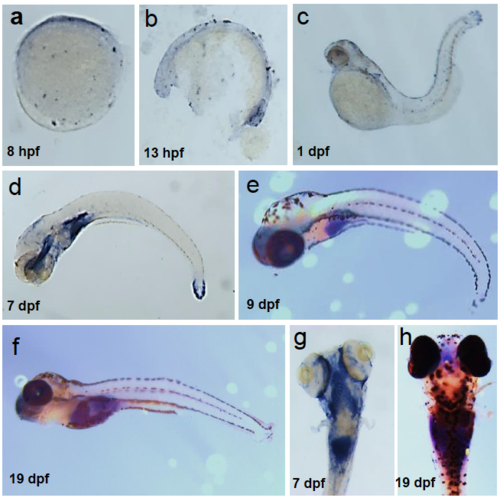
Spatiotemporal expression of zebrafish rltgr mRNA. Wild type embryos were stained by ISH to identify the cells or tissues that express rltgr (a-h). (a-f) are whole mount embryos is lateral view, anterior to the left. (g-h) is a dorsal view. EXPRESSION / LABELING:
|
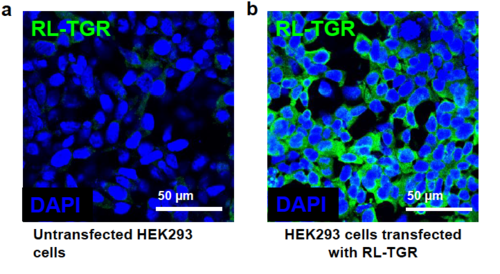
Specificity of custom-generated anti-RLTGR antibody with RL-TGR protein. (a) Confocal image of the untransfected Human Embryonic Kidney (HEK) 293 cells immunostained with anti-RL-TGR antibody (green) followed by staining with DAPI that stains nuclei blue. (b) Confocal image of HEK293 cells transfected with mammalian expression vector, pcDNA3.1 (+) containing coding region of rltgr and then immunostained with anti-RL-TGR antibody (green) followed by staining with DAPI (blue). The green fluorescence observed in cells expressing recombinant RL-TGR protein indicates that the custom generated antibodies recognize specifically the RL-TGR protein. |
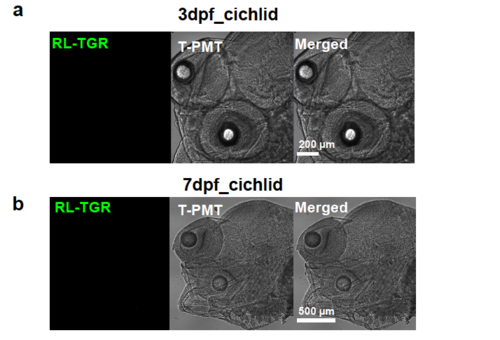
Negative staining with anti-RL-TGR antibody in cichlid embryos (Maylandia zebra) that do not have rltgr gene. (a) Confocal image showing 3 dpf wild type cichlid embryos immunostained with anti-RL-TGR antibody (green). (b) Confocal image showing 7 dpf wild type cichlid embryos immunostained with anti-RL-TGR antibody (green). There was no green fluorescence detected in both stages in cichlid because cichlid genome do not contain rltgr gene and therefore do not have RL-TGR protein. This negative control further validates the specificity of anti-RL-TGR antibody in reacting with RL-TGR protein. |
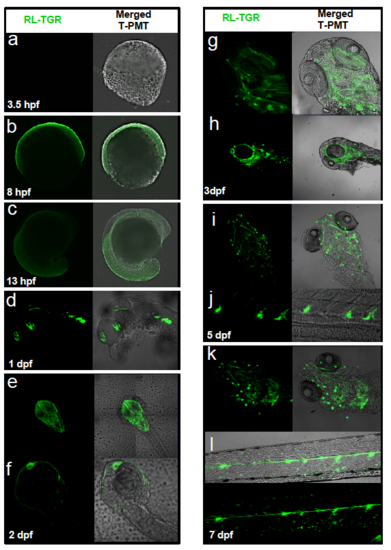
Spatiotemporal expression of zebrafish RL-TGR protein. Wild type embryos were immunostained with anti RL-TGR antibodies to identify the cells or tissues that express RL-TGR protein (a-l). (a-d,f,h,j,l) are whole mount embryos in lateral view, anterior to the left. (e,g,i, k) is a dorsal view. EXPRESSION / LABELING:
|
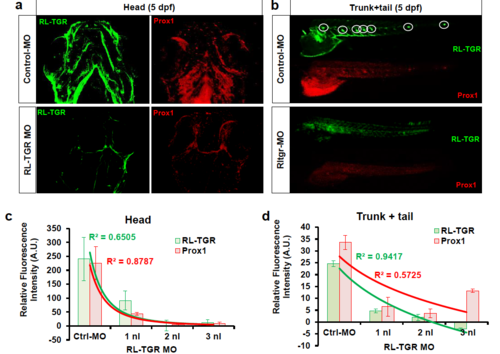
(a) Double immunostaining of RL-TGR and Prox1 in embryos injected with control and RL-TGR MO (5dpf). (b) Relative fluorescence intensity of RL-TGR and Prox1 in embryos injected with control and RL-TGR MO (5dpf). |
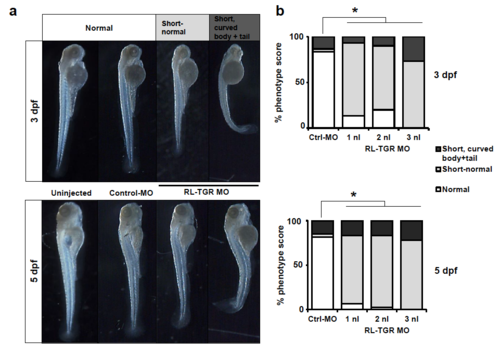
Dose dependent effect of RL-TGR morpholino. (a) Assessment of morphological defects in the morpholino injected embryos compared to control, at 3 and 5 dpf (b) Percent phenotype scores of RL-TGR morphants and controlmorphants (*P<0.0001, n=30-81). PHENOTYPE:
|