
- Title
-
MicroRNA miR-29 controls a compensatory response to limit neuronal iron accumulation during adult life and aging
- Authors
- Ripa, R., Dolfi, L., Terrigno, M., Pandolfini, L., Savino, A., Arcucci, V., Groth, M., Terzibasi Tozzini, E., Baumgart, M., Cellerino, A.
- Source
- Full text @ BMC Biol.
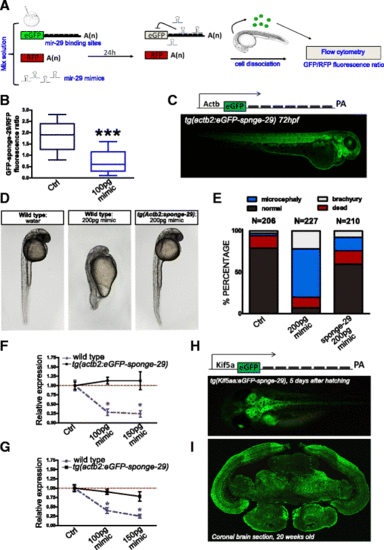
Generation of mir-29 loss of function N. furzeri. a Scheme of the reporter assay for miR-29 activity. Green fluorescent protein (GFP) mRNA carrying multiple miR-29 binding sites is injected in one-cell stage zebrafish embryos along with red fluorescent protein (RFP) mRNA, as a loading control, and miR-29 mimics. Control embryos are injected with same mix without miR-29 mimics. Binding of miR-29 mimics to reporter mRNA causes repression of GFP signal. At 24 hours post injection embryos are dissociated (n = 30–40) and cells relative fluorescence is read by flow cytofluorescence. b Fluorescence cell analysis. MiR-29 mimics strongly reduced eGFP-sponge signal (***P < 0.001, T-test). Whisker plots indicate the 10%, 25%, median, 75%, and 90% ranges. c On the top the expression cassette, consisting of 5.3 kb of zebrafish actb2 promoter, eGFP fused to a synthetic 3′-UTR containing seven repetitions of miR-29 binding site, and a SV40 late poly-A tail is reported. A tg(actb2:eGFP-sponge-29) F1 embryo generated by Tol2-mediated transgenesis is shown at the bottom. d, e Wild-type and F1 transgenic zebrafish were injected with 200 pg of miR-29a or miR-29b mimics at the one cell stage, control embryos were injected with water and red phenol only. Picture (d) shows representative control embryos, wild-type embryos +200 pg mimics, transgenic embryos + 200 pg mimics at 24 hpf. Stacked bar chart (e) represent the percentages of embryos with different phenotypes (normal, death, microcephaly, and brachyury) in the three conditions. f, g Expression level at 24 hpf of Col11a1, Elna, Ireb2, and Tfr1a upon miR-29 mimic injections. One-stage wild-type and sponge-29 line were injected with different doses (100 and 150 pg) of microRNA mimics and the expression level determined by RT-qPCR. Statistical significance was assessed by one-way ANOVA with post-hoc Tukey’s test (*P < 0.05), the analysis was performed on total RNA extraction from 30–40 embryos for each condition. Error bars indicate standard errors of means. h Schematic representation of sponge expression cassette driven by 3.1 kb of kif5aa promoter and the tg(kif5aa:eGFP-sponge-29) f1 killifish embryo, 5 days after hatching. i eGFP immunodetection on tg(kif5aa:Egfp-sponge-29) 20-week-old killifish brain section |
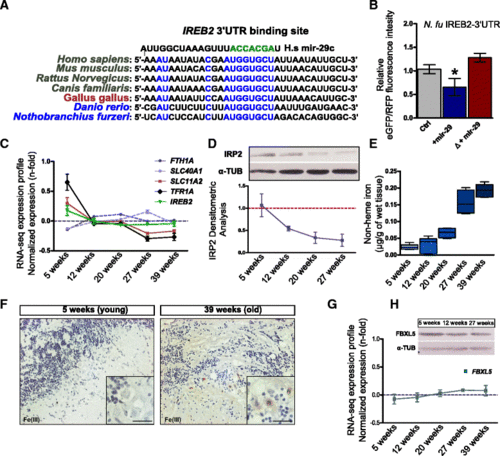
MiR-29 family targets Ireb2 mRNA. a Presence of a putative binding site for miR-29 family in the Ireb2 mRNA 3′-UTR sequence in several vertebrate species (H. sapiens: ENSG00000136381; M. musculus: ENSMUSG00000032293; R. norvegicus: ENSRNOG00000013271; C. familiaris: ENSCAFG00000001766; G. gallus: ENSGALG00000003171; D. rerio: ENSDARG00000021466; N. furzeri: Nofu_GRZ_cDNA_3_0193494), mammalian sequences are in black, birds in purple, and teleost fish in blue. Perfect match to positions 2–8 of the miR-29 seed sequence is highlighted in green and is present in all vertebrate sequences shown. b Expression of GFP assessed by cytofluorometric analysis. Fusion with Ireb2 3′-UTR of N. furzeri. The gray column reports the baseline fluorescence intensity of the construct without miR-29 mimic. The middle blue column reports the fluorescence with miR-29 mimic and the red column the fluorescence of a construct (Δ) where the putative binding site for miR-29 in the Ireb2 3′-UTR was mutated to destroy complementarity. Statistical significance of fluorescence difference between baseline and co-injection with miR-29 mimics was evaluated by Student’s t-test (* P < 0.05). c Age-dependent regulation of transcripts coding for key genes of iron metabolism, from Baumgart et al. [46]. One-way ANOVA for linear trend is reported for each gene: Tfr1a (R = 0.5009; P < 0.0001), Scl11a2 (R = 0.3892; P < 0.01), Fth1a (R = 0.067; P = 0.11), Slc40a1 (R = 0.078; P = 0.11), Ireb2 (R = 0.141; P = 0.069). Expression values (in RPMKs) for each age were centered and scaled to the mean, n = 5 animals for age point. d Representative Western blot of IRP2 in brain extracts and densitometric analysis relative to Additional file 8a (Kruskal–Wallis test, P = 0.0216, n = 3 animal for each age point). α-TUBULIN was used as loading control. e Brain non-heme iron content (μg/g wet tissue) in fish of different ages. (One-way ANOVA: P < 0.0001). f DAB-enhanced Perls staining of the cerebellum of young and old fish. The black arrows point to labelled Purkinje cells. The inset in the bottom right corner of each picture shows a magnification of the Purkinje cell bodies. g, h Age-dependent expression of Fbxl5 mRNA (ANOVA for linear trend: R = 0.1922, P = 0.0688) and western blot of FBXL5 in brain lysates at three age points (5, 12, and 27 weeks). α-TUB was used as loading control. For b, c, d, e, g mean ± standard errors of means is reported |
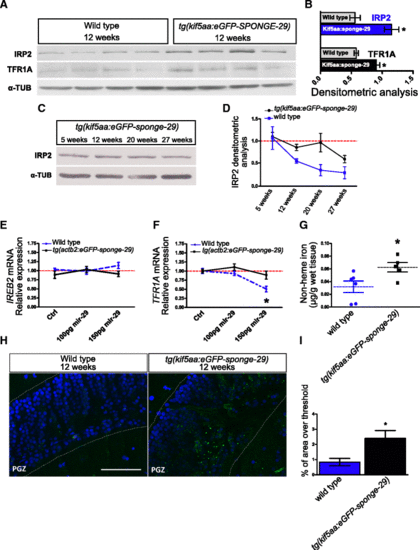
Genetic repression of miR-29 chronically affects iron homeostasis. a, b Western blot of IRP2 and TFR1A in 12-week-old tg(kif5aa:eGFP-sponge-29) (n = 4) and wild-type (n = 4) fish brain extracts and (b) relative densitometric analysis (*P < 0.05; **P < 0.01, Mann–Whitney U-test). c Representative Western blot of IRP2 in brain extracts of kif5a:sponge-29 at different ages (5, 12, 20, 27). In a–c α-TUBULIN was used as loading control. d Comparison of densitometric analysis calculated on Additional file 8a and b. The blue line represents IRP2 expression in tg(kif5aa:eGFP-sponge-29) animals, gray line represents expression in wild-type fish. Values were normalized to the mean of 5 weeks value (Kruskal–Wallis test, P = 0.0939, n = 3 animals for each age point). e, f Expression level at 24 hpf of Ireb2 and Tfr1a upon miR-29 mimics injection. The expression level was determined by RT-qPCR. Statistical significance was assessed by one-way ANOVA with post-hoc Tukey’s test (*P < 0.05), the analysis was performed on total RNA extraction from 30–40 embryos for each condition. Error bars indicate standard errors of means. g Brain non-heme iron content (μg/g wet tissue) in kif5a:eGFP-sponge-29 (n = 5) compared to wild-type (n = 6) at age 12 weeks (*P < 0.05, Mann–Whitney U-test). h Representative images of lipofuscin accumulation in the optic tectum of 12-week-old kif5a:eGFP-sponge-29 and wild-type fish brains. Lipofuscin auto-fluorescent granules (green) were detected with ApoTome microscope, counterstained with DAPI (blue). Scale bar: 50 μm. i Quantification of lipofuscin density based on percentage of area over threshold, n = 6 (*P < 0.05; Mann–Whitney U-test) |