
- Title
-
Cell-to-cell heterogeneity of EWSR1-FLI1 activity determines proliferation/migration choices in Ewing sarcoma cells
- Authors
- Franzetti, G.A., Laud-Duval, K., van der Ent, W., Brisac, A., Irondelle, M., Aubert, S., Dirksen, U., Bouvier, C., de Pinieux, G., Snaar-Jagalska, E., Chavrier, P., Delattre, O.
- Source
- Full text @ Oncogene
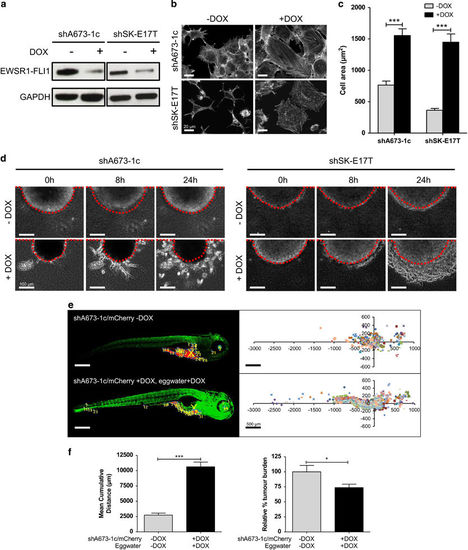
EWSR1-FLI1low cells demonstrate increased migration and invasion in three-dimensional matrix and in zebrafish. (a) Western blot, (b) phalloidin-stained actin cytoskeleton and (c) measure of cell area of shA673-1c and shSK-E17T clones treated for 10 days (+DOX) with 1 μg/ml DOX or untreated (-DOX) (n=15 per group). Scale bars represent 20 μm. Error bars represent s.e.m. DOX-treated/untreated cells were compared using Welch t-test (***P<0.001). See also Supplementary Figures S1 and S2, Supplementary Tables S1 and S2. (d) Three-dimensional collagen-I multicellular spheroid invasion assay with shA673-1c and shSK-E17T spheroids prepared by the hanging droplet method. 24-h videos were acquired and three time-points are shown. Red dotted lines represent the initial spheroid perimeter. Scale bars represent 100 μm. See also Supplementary Movie S1. (e) Representative pictures of zebrafish xenotransplantation model 4 days post-injection and cumulative results of migration distance of shA673-1c/mCherry cells, DOX-treated or -untreated, from implantation site (X) into the yolk sac for all zebrafish embryos, where each colour represents an individual embryo, and each dot a cluster of one or more tumour cells. Scale bars represent 500 μm. (f) Mean cumulative distance of migration and relative tumour burden of shA673-1c/mCherry cells (n=22 to 27 fish per group), error bars represent 1-way ANOVA with Bonferroni post-test (*P<0.05, ***P<0.001). |