
- Title
-
Atomic structure of a toxic, oligomeric segment of SOD1 linked to amyotrophic lateral sclerosis (ALS)
- Authors
- Sangwan, S., Zhao, A., Adams, K.L., Jayson, C.K., Sawaya, M.R., Guenther, E.L., Pan, A.C., Ngo, J., Moore, D.M., Soriaga, A.B., Do, T.D., Goldschmidt, L., Nelson, R., Bowers, M.T., Koehler, C.M., Shaw, D.E., Novitch, B.G., Eisenberg, D.S.
- Source
- Full text @ Proc. Natl. Acad. Sci. USA
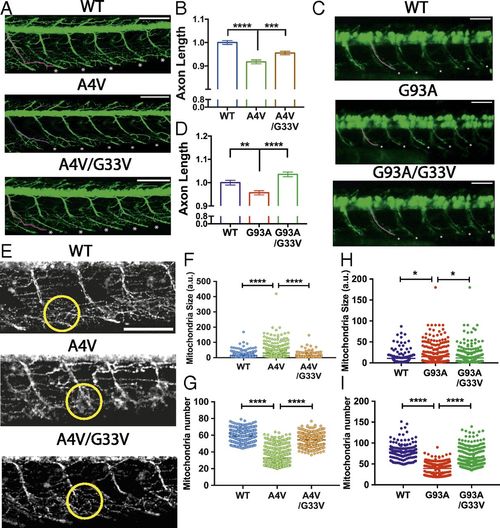
Corkscrew-disrupting substitution of G33V alleviates axonopathies in a D. rerio (zebrafish) ALS model. (A) Micrographs of zebrafish embryos at 2 d postfertilization (dpf) show a reduction in axon lengths of A4V-expressing embryos, whereas corkscrew-disrupted A4V/G33V-expressing embryos have significantly longer axon lengths. The first axon is highlighted in pink for clarity, and axons measured for quantification are marked by an asterisk. (Scale bars, 100 μm.) (B) Quantification of axon lengths shows that A4V-expressing embryos have shorter axons than WT-expressing embryos. The corkscrew-disrupting substitution G33V alleviates the defect. Results are shown as mean ± SEM relative to WT for at least 72 embryos. Statistical significance was analyzed by one-way ANOVA. (C) Micrographs of zebrafish embryos at 2 dpf show a reduction in axon lengths of G93A-expressing embryos, whereas corkscrew-disrupted G93A/G33V-expressing embryos have significantly longer axons. The first axon is highlighted in pink for clarity, and axons measured for length are marked by an asterisk. (Scale bars, 100 μm.) (D) Quantifications of axon lengths show that G93A-expressing fish have shorter axons than WT-expressing fish. The corkscrew-disrupting substitution G33V alleviates the defect. Results are shown as mean ± SEM relative to WT for axons 12–16 of at least 73 embryos. Statistical significance was analyzed by one-way ANOVA. (E) Micrographs show A4V-expressing zebrafish have impaired mitochondria, which are clustered at the branch points (encircled) compared with WT. The mitochondrial network of A4V/G33V-expressing fish is similar to WT. (Scale bar, 100 μm.) (F and G) Quantitative analysis of the mitochondrial network shows A4V-expressing fish have a larger mitochondrial size [30.17 arbitrary units (a.u.)] and diffused clustering (fluorescence intensity of 32 a.u.) in the axons, indicative of defective fission, whereas A4V/G33V-expressing fish have healthy mitochondria (size of 10.57 a.u. and fluorescence intensity of 54 a.u.) similar to WT (size of 14.08 a.u. and fluorescence intensity of 58 a.u.). Symbols represent individual measurements made for each group. Statistical significance was analyzed by one-way ANOVA. (H and I) Quantitative analysis of the mitochondria network shows G93A-expressing fish have larger, more diffusely clustered mitochondria (size of 14.68 a.u. and fluorescence intensity of 39 a.u.), indicative of defective fission. The mitochondrial network of G93A/G33V-expressing fish (size of 11.68 a.u. and fluorescence intensity of 59 a.u.) is similar to WT (size of 10.78 a.u. and fluorescence intensity of 78 a.u.). Statistical significance was analyzed by one-way ANOVA. Symbols represent individual measurements for each group (*P < 0.05, **P < 0.01, ***P < 0.001, ****P < 0.0001). |