
- Title
-
Clinico-biological significance of suppressor of cytokine signaling 1 expression in acute myeloid leukemia
- Authors
- Hou, H.A., Lu, J.W., Lin, T.Y., Tsai, C.H., Chou, W.C., Lin, C.C., Kuo, Y.Y., Liu, C.Y., Tseng, M.H., Chiang, Y.C., Peng, Y.L., Tang, J.L., Gong, Z., Lin, L.I., Tien, H.F.
- Source
- Full text @ Blood Cancer J

Generation of transgenic zebrafish expressing human SOCS1 driven by spi1 promoter. (a) Diagram of the spi1:SOCS1-2A-mCherry/CG2 construct, which contains Tol2 sequences and the cmlc2:EGFP expression cassette. (b) Fluorescent images of spi1:SOCS1-2A-mCherry larva at 24 hpf. The red dots denote SOCS1-expressing myeloid cells and the green denotes fluorescent transgenesis marker in the heart. (c) Semi-quantitative PCR showing the expression of SOCS1 in transgenic larva at 24, 48 and 72 hpf. Actin as an internal control. Positive control: plasmid of spi1:SOCS1-2A-mCherry/CG2, Negative control: non-template. EXPRESSION / LABELING:
|
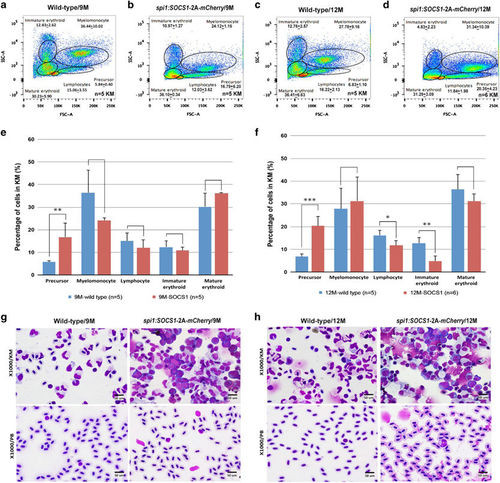
Fluorescence-activated cell sorting analysis and morphological analysis of hematopoietic cells from the kidney marrow or peripheral blood of spi1:SOCS1-2A-mCherry transgenic fish showing increased myelopoiesis with expansion of myeloid precursors at 9 and 12 months of age. (a–d) A total of 30 000 cells from the kidney marrow per animal were analyzed to differentiate various subtypes of hematopoietic cells by flow cytometry. (e and f) The numbers of various subtypes of hematopoietic cells were counted and expressed as mean s.e.m. Gate populations are as follows: immature erythroid, mature erythroid, lymphocytes, myelomonocytes and precursor cells. Mean percentage of cells is indicated for each gated subpopulation. (g and h) Microscopic observation of cytospin smears of the kidney marrow (upper panel) and peripheral blood (lower panel) at 9 months (g) and 12 months (h) showing increased blasts in spi1:SOCS1-2A–mCherry transgenic fish (right), compared with wild-type fish (left). Blasts can be seen in the PB of 12-month transgenic fish (h). Differences among variables were assessed using a Student’s t-test. Significant differences between wild-type and SOCS1 transgenic fish are indicated as follows: *P<0.05; **P<0.01; and ***P<0.001. PHENOTYPE:
|
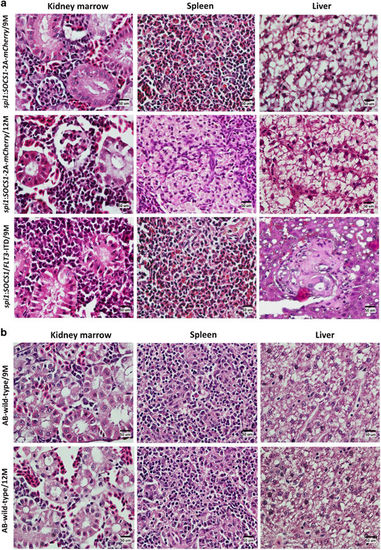
Histopathological examination of the kidney marrow, spleen and liver of spi1:SOCS1-2A-mCherry or SOCS1/FLT3-ITD double transgenic fish. (a and b) Hematoxylin and eosin stains of the kidney marrow, spleen and liver from 9- and 12-month old spi1:SOCS1-2A-mCherry transgenic, SOCS1/FLT3-ITD double transgenic and wild-type fish. Kidney marrows from spi1:SOCS1-2A-mCherry transgenic or SOCS1/FLT3-ITD double transgenic fish show increased infiltration by myeloid cells compared with wild-type fish. |

The mCherry-positive cells (that is, cells that expressed SOCS1) was colocalized with EGFP-positive cells (that is, myeloid cells). |

The SOCS1 protein expression in the myeloid cells was detected via immunohistochemistry of the kidney marrow, spleen and liver of the 12-month-old spi1:SOCS1-2A-mCherry transgenic fish. (A) Sections showing SOCS1-positive cells in the kidney marrow of spi1:SOCS1-2A- mCherry transgenic but not of wild-type fish (B). Arrows denote SOCS1 positive cells. T: renal tubule. |

FACS analysis and morphological analysis of hematopoietic cells from the kidney marrow or peripheral blood of SOCS1/FLT3-ITD double transgenic fish showing leukemic phenotype at 9 months of age. (A) A total of 30,000 cells from the kidney marrow per animal were analyzed to differentiate various subtypes of hematopoietic cells by flow cytometry. (B) The numbers of various subtypes of hematopoietic cells in the kidney marrow were counted and expressed as mean standard error of the mean. Gate populations are as follows: immature erythroid, mature erythroid, lymphocytes, myelomonocytes and precursor cells. Mean percentage of cells is indicated for each gated subpopulation. (C) Cytospin smear of the kidney marrow sowing infiltration of blasts and other immature myeloid cells. (D) Cytospin smear of peripheral blood showing a blast cell. Differences among variables were assessed using a Student’s t-test. Significant differences between wild-type and SOCS1/FLT3-ITD double transgenic fish are indicated as follows: *, P<0.05; **, P<0.01; and ***, P<0.001. |