
- Title
-
Effects of microgravity simulation on zebrafish transcriptomes and bone physiology-exposure starting at 5 days post fertilization
- Authors
- Aceto, J., Nourizadeh-Lillabadi, R., Bradamante, S., Maier, J.A., Alestrom, P., van Loon, J.J., Muller, M.
- Source
- Full text @ NPJ Microgravity
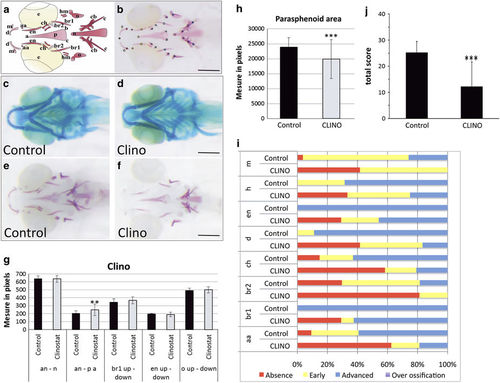
Effects in 10 dpf zebrafish larvae after 5 days sim-μg in clinorotation (a) Schematic representation of the different cranial bone elements revealed by alizarin red staining in 9–10 dpf zebrafish larvae and (b) the landmarks used for morphometric analysis. The landmarks used in morphometric analysis are anguloarticular (aa), anterior (an), branchiostegal ray1 (br1), entopterygoid (en), maxilla (m), notochord (n), opercle (o), and parasphenoid (p). Note that the parasphenoid is a triangular bone defined by its anterior summit (a) and two posterior summits (b,c). Additional bone elements that were evaluated for extent of ossification are: branchiostegal ray2 (br2), cleithrum (c), ceratobranchial 5 (cb), ceratohyal (ch), dentary (d), and hyomandibular (hm) (from ref. 9). (c,d) Alcian blue staining of cartilage. (e,f) Alizarin red staining of bone structures. Compared with controls (C), no effect was observed on cartilage development after 5 days clinorotation (D). In contrast, relative to control (E), a clear decrease of bone formation was seen after 5 days in clinostat (F). Scale bars=250 μm. (g) Morphometry. A significant increase of the distance between the anterior part of the larvae and the parasphenoid summit is observed. The distances are measured in pixels. Mean±s.d. and t-test analysis were calculated for each measure on at least 20 individuals. (h) The area covered by the parasphenoid is decreased on clinostat exposure. (i) Extent of bone formation: Bone development is classified for each element into different categories: Absent (no structure present; red), early ossification (beginning of the bone ossification; yellow), advanced ossification (the structure is present and already developed as the control; green), and over ossification (the structure is more developed compared with the control; purple). Cumulated frequencies in % are represented for each element. As no significant difference was observed for paired structures between left and right (up and down), their scores have been combined. Statistical analysis was performed by X2 of Pearson and a logistic regression. (i) Cumulated frequency after 5 days in clinostat. (j) To obtain global scores, the scores attributed to each element were added up for each individual larva. Mean±s.d. and t-test analysis was obtained on at least 20 individuals. **P<0.005 and ***P<0.001. dpf, days post fertilization. PHENOTYPE:
|

ZFIN is incorporating published figure images and captions as part of an ongoing project. Figures from some publications have not yet been curated, or are not available for display because of copyright restrictions. PHENOTYPE:
|
|
ZFIN is incorporating published figure images and captions as part of an ongoing project. Figures from some publications have not yet been curated, or are not available for display because of copyright restrictions. |