
- Title
-
Left Habenular Activity Attenuates Fear Responses in Larval Zebrafish
- Authors
- Duboué, E.R., Hong, E., Eldred, K.C., Halpern, M.E.
- Source
- Full text @ Curr. Biol.

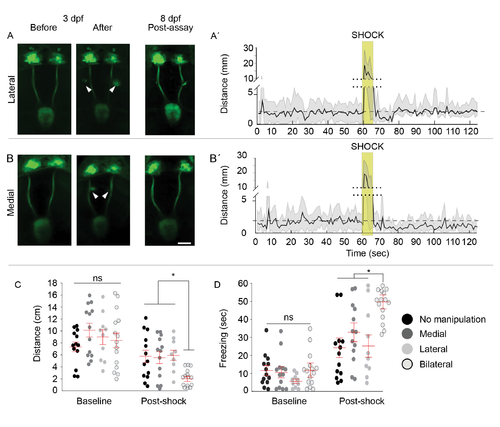
Intact Left dHb-IPN Pathway Required to Mitigate Fear Behaviors (A–D) Live imaging of TgBAC(gng8:nfsB-EGFP-CAAX) larvae with the Hb-IPN pathway intact (A) or before and after bilateral (B), left (C), or right (D) (white arrowheads) severing of the fasciculus retroflexus (FR) at 3 d. FR lesions were confirmed at 8 d following behavioral testing. The left (L) and right (R) dHb are indicated. Scale bar, 50 μm. dpf, days post fertilization. (A′–D′) Corresponding locomotor activity measured in 1-s intervals pre and post shock. Mean activity (solid black lines) relative to pre-shock levels (dashed lines) and SE (light gray) are indicated. The y axis is split (dotted lines) to include heightened activity during shock (gold boxes). (E and F) Locomotor activity (E) was decreased in larvae with the left FR severed (n = 20; Kruskal-Wallis ANOVA H = 54.35, p < 0.0001; Dunn’s post test; p < 0.05) relative to uncut controls (n = 9) or those with the right FR severed (n = 19), and duration of freezing (F) also increased (n = 20; Kruskal-Wallis ANOVA H = 35.75, p < 0.01; Dunn’s post test, p < 0.05). Horizontal bars representing mean ± SEM for 1-min intervals pre and post shock are superimposed over scatterplots of individual larvae (circles). No significance (ns) and significance below p = 0.05 (∗) are noted. See also Figures S1 and S2. |
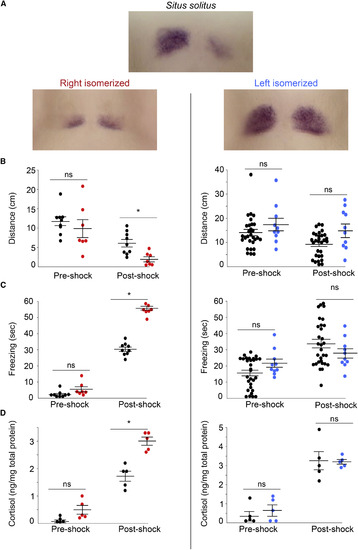
Fear Responses Are Diminished by dHb with Left Identity Expression pattern of kctd12.1 in 7- to 8-day-old larvae with typical situs (situs solitus) and those with right- (red) or left- (blue) isomerized dHb (A). Following shock, larvae with right-isomerized dHb (n = 7) show a significant reduction in swimming (B) (Mann-Whitney U = 6, p < 0.01) and a significant increase in freezing duration (C) (Mann-Whitney U = 91, p < 0.001) and cortisol levels (D) (Mann-Whitney U = 0, p < 0.001) compared to controls (n = 9). Significant differences were not observed between larvae with left-isomerized dHb (n = 10) and their wild-type siblings (n = 30) for distance traveled (B, right) (Mann-Whitney U = 110, p = 0.221), freezing duration (C, right) (Mann-Whitney U = 71, p = 0.07), or cortisol levels (D, right) (averaged from five pools of 15 larvae; Mann-Whitney U = 10.5, p = 0.7302) post shock. Horizontal bars representing mean ± SEM are superimposed over scatterplots of individual larvae (circles). In (B) and (C), pre- and post-shock measurements correspond to 1-min intervals. Significance below p = 0.05 (∗) is noted. See also Figure S1. |
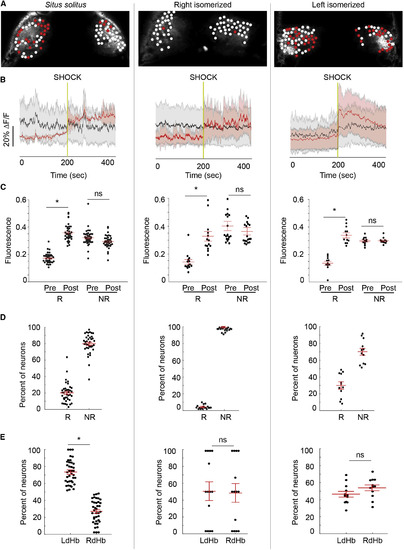
Activation of Neurons with Left dHb Identity Is Correlated with Behavioral Recovery (A) Confocal images of dHbs in 7- to 8-day-old Tg(gng8:gal4ff); Tg(UAS:GCaMP7a) larvae. Red circles mark neurons that show increased activation post shock, and white circles mark those that are unchanged. (B) Average change in fluorescence intensity (ΔF/F) for responsive (red) and unresponsive (gray) neurons. Red and black lines represent the mean for all dHb neurons tested (n = 4,195 in 38 situs solitus from eight clutches; n = 1,246 in 18 right isomerized from four clutches; n = 1,068 in 12 left isomerized from four clutches), and the shaded areas represent SEM. Vertical gold lines indicate time of shock. (C and D) Mean fluorescence intensity (C), calculated as the area under the curve, during 200 s pre- and post-shock intervals for responsive (R) and nonresponsive (NR) neurons. Mean fluorescence was significantly elevated post shock in all configurations (situs solitus, Wilcoxon W = 741, p < 0.0001; right isomerized, Wilcoxon W = 105, p < 0.0001; left isomerized, Wilcoxon W = 105, p < 0.0001). However, far fewer neurons were responsive in right-isomerized dHb (D) (Kruskal-Wallis ANOVA H = 50.4; situs solitus, 20.2% ± 2.0%; right isomerized, 2.4% ± 0.6%, Dunn’s post test, p < 0.0001; left isomerized, 30.0% ± 4.1%, Dunn’s post test, p < 0.0001). (E) Responsive neurons are more abundant in the left dHb of situs solitus larvae (left; Wilcoxon W = 741, p < 0.0001) but are distributed equally between both dHbs in right- (Wilcoxon W = 1, p > 0.05) and left-isomerized individuals (Wilcoxon W = 81, p > 0.05). Black circles in (C)–(E) correspond to individual larvae, and red bars represent mean ± SEM superimposed over each scatterplot. Significance below p = 0.05 (∗) is noted. See also Figures S3 and S4 and Movie S2. |
Increased freezing after shock in larvae with bilaterally severed FR; related to Figure 1 (A-B) Live confocal images of the Hb-IPN pathway in Tg(gng8:nfsB-GFP-CAAX) controls with lesions (white arrow heads) (A) lateral (n=10) or (B) medial (n=13) to the FR captured at 3 d before and after laser exposure, and 5 day later following behavioral testing. Scale bar is 50 μm. (C) Total distance traveled significantly decreased post-shock in larvae with bilaterally severed FR (n=15; Kruskal-Wallis ANOVA H=27.3; p<0.0001; Dunn’s post test, p<0.05) compared to uncut controls (n=13) or those with lesions medial (n=13) or lateral (n=10) to the FR. (D) Freezing was also significantly increased (Kruskal-Wallis ANOVA H=28.22, p<0.0001; Dunn’s post-test, p<0.05). Horizontal bars superimposed over scatter plots of individual larvae (circles) represent mean ±SEM for 1-min pre- and post-shock intervals. No significance (ns) and significance below p=0.05 (*) are denoted. |

Increase in dHb neuronal activation post-shock; related to Figure 4 (A) Live imaging of 8 day Tg(gng8:gal4);Tg(UAS:GCaMP7a) larva paralyzed with rhodamine conjugated a-bungarotoxin. Dorsal view, anterior to the left. Left panel shows GCaMP7a labeling, middle panel is rhodamine labeling and right panel is merged image. Background fluorescence was masked using Fiji and Matlab. (B) Histogram of log fold change in GCaMP7a activation (ln) of 4195 neurons post-shock, with corresponding probability density function (solid red line). Mean and standard deviation indicated by vertical dashed lines. Neurons were defined as responsive when their fold change in activity exceeded 1 standard deviation. (C) Representative traces of fluorescence (ΔF/F) for responsive (red) and nonresponsive neurons (black). (D) Representative traces of responsive neurons with firing events (blue arrowheads) identified using the findpeaks function in MATLAB. (E) Distribution of timing to first firing event post-shock for responsive neurons in the dHb of situs solitus larvae, and those with left or right isomerized dHb. |