
- Title
-
High Consumption of Iron Exacerbates Hyperlipidemia, Atherosclerosis, and Female Sterility in Zebrafish via Acceleration of Glycation and Degradation of Serum Lipoproteins
- Authors
- Kim, S.H., Yadav, D., Kim, S.J., Kim, J.R., Cho, K.H.
- Source
- Full text @ Nutrients
|
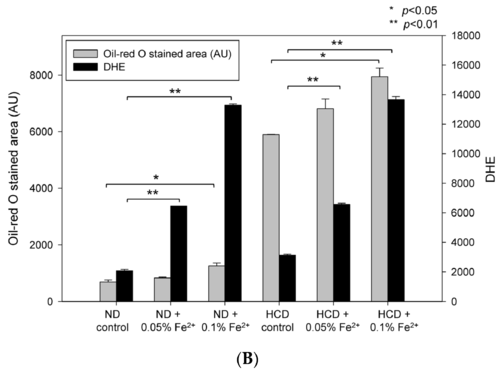
Histological analysis of hepatic tissue. (A) Representative sections for histological assessment of hepatic microsections after consumption of ferrous ion (0.05% and 0.1% wt/wt in diet) for 24 weeks under normal diet (ND) or high cholesterol diet (HCD). Extent of fatty liver changes was compared by oil red O staining. Production of reactive oxygen species was determined by Dihydroethidium (DHE) staining and visualized by fluorescence (Ex = 588 nm, Em = 615 nm); (B) Quantification of oil red O stained area and DHE stained area by computer-assisted morphometry using Image Proplus software (version 4.5.1.22; Media Cybernetics, Rockville, MD, USA). *, p < 0.05; **, p < 0.01. 
|
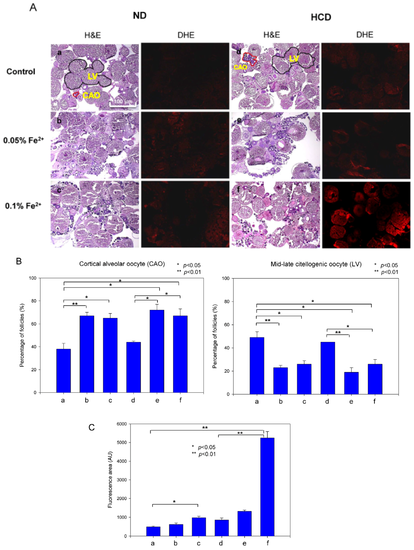
Histological analysis of ovarian tissue. (A) H & E staining of frozen ovarian tissues from zebrafish fed 0.05% and 0.1% Fe2+ under normal diet (ND) or high cholesterol diet (HCD) for 24 weeks. CAO, cortical alveolar oocytes; LV, Mid-late vitellogenic oocytes (scale bar 100 µm). Reactive oxygen species production at 48 hours post fertilization (hpf) as visualized by DHE staining using quantification of fluorescence (Ex = 588 nm, Em = 615 nm); (B) Graph shows the average value of CAO and LV area. a, ND control; b, ND + 0.05% Fe2+ (wt/wt in diet); c, ND + 0.1% Fe2+ (wt/wt in diet); d, HCD control; e, HCD + 0.05% Fe2+; f, HCD + 0.1% Fe2+. *, p < 0.05; **, p < 0.01; (C) Quantification of DHE stained area by computer-assisted morphometry using Image Proplus software (version 4.5.1.22; Media Cybernetics, Rockville, MD, USA). *, p < 0.05; **, p < 0.01. |

ZFIN is incorporating published figure images and captions as part of an ongoing project. Figures from some publications have not yet been curated, or are not available for display because of copyright restrictions. PHENOTYPE:
|