
- Title
-
Physical limits of flow sensing in the left-right organizer
- Authors
- Ferreira, R.R., Vilfan, A., Jülicher, F., Supatto, W., Vermot, J.
- Source
- Full text @ Elife
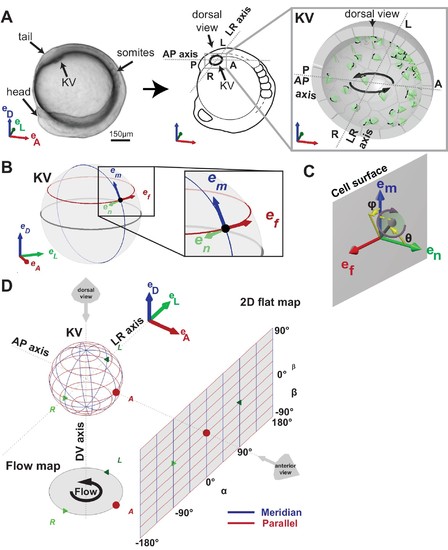
Definition of coordinate systems of the Kupffer’s vesicle (KV). (A) Side view of a zebrafish embryo at 5-somite stage (left panel) and its schematic drawing (middle panel), highlighting the KV localization (grey box). The zoom-up box (right panel) shows the schematic transverse section of the KV, depicting the cilia (in green), their rotational orientation (black curved arrows) and the directional flow (thick black arrows). (B) em, en, ef are the local basis on the ellipsoid, which are used to define cilia orientation. The vector em is aligned along a meridian (blue) from the ventral to the dorsal pole; ef follows a parallel (red) in the direction of the typical directional flow within the vesicle; en is the vector normal to the KV surface and pointing towards the center of the vesicle (green). (C) Cilia 3D orientation is quantified by two angles: θ (tilt angle from the surface normal en) and φ (angle between the surface projection of the cilia vector and the meridional direction). (D) 2D flat map representation of the KV surface with coordinates α and β. The origin is set in the anterior pole. The embryonic body plan directions are marked as A (anterior), P (posterior), L (left), R (right), D (dorsal) and V (ventral). The body plan reference frame is defined as vectors eD, eL, eA. |
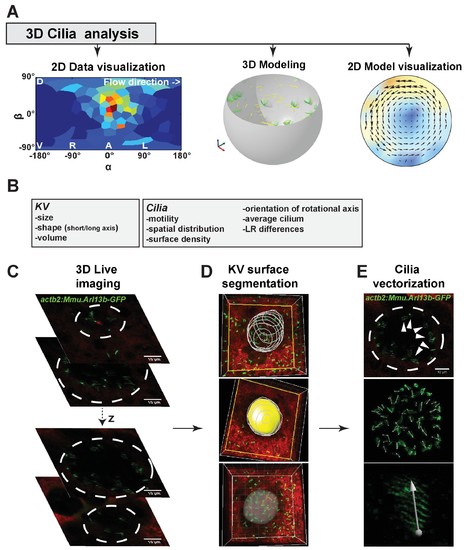
Multiscale analysis from individual cilia to 3D modeling of the Kupffer’s vesicle (KV). (A) 3D-CiliaMap workflow pipeline: 3D live imaging with cilia analysis, followed by 2D visualization of cilia maps, 3D flow calculation based on live datasets, and flow visualization. (B) List of the KV and cilia features extracted using 3D-CiliaMap. (C–E) Successive steps forming the 3D-CiliaMap workflow from 3D live imaging to cilia vectorization (see also Video 1): (C) 3D live imaging of the total volume of the KV, using Tg (actb2:Mmu.Arl13b-GFP) (Borovina et al., 2010) embryos soaked for 60 min in Bodipy TR (Molecular Probe) - dashed white lines underline the KV. (D) Using Imaris (Bitplane Inc.), the KV surface is manually segmented to reveal only the cilia belonging to the surface of the KV cells. (E) Slow acquisition speed with standard laser scanning microscopy allows detecting the cilia orientation in the KV using the Tg (actb2:Mmu.Arl13b-GFP) line: dashed white lines underline the KV (upper panel); dorsal view of the whole vesicle showing the vectors obtained from the GFP signal (middle panel); high magnification of a cilium with a vector corresponding to its rotational axis orientation (bottom panel). |