
- Title
-
Genetic-Variation-Driven Gene-Expression Changes Highlight Genes with Important Functions for Kidney Disease
- Authors
- Ko, Y.A., Yi, H., Qiu, C., Huang, S., Park, J., Ledo, N., Köttgen, A., Li, H., Rader, D.J., Pack, M.A., Brown, C.D., Susztak, K.
- Source
- Full text @ Am. J. Hum. Genet.
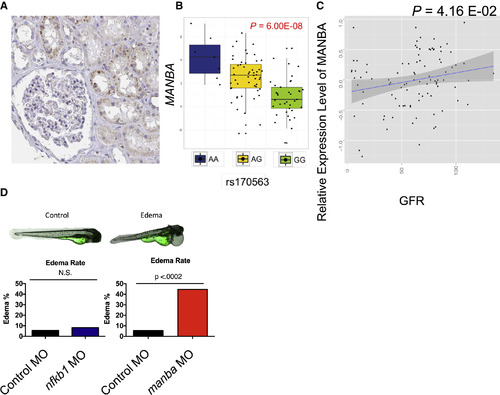
Gene Expression Analyses of MANBA (A) Immunohistochemistry staining with MANBA in human kidney tissues (Protein Atlas). (B) Boxplot showing association between rs170563 genotype and MANBA expression in human kidney. (C) Gene expression correlation with eGFR (the leading indicator of kidney function) in a different independent cohort of 95 human kidneys. (D) Kidney defect phenotype observed in zebrafish after manba knockdown. Pericardial edema after gene knockdown is shown on the right panel; the control-injected zebrafish has no edema at 200 μM concentration. (E) Edema rate of zebrafish after nfkb1 and manba knockdown; p values were calculated for each concentration group using Fisher’s exact test. We tested the suggested target gene from a GWAS to confirm the eQTL analysis result. Number of zebrafish observed in the analysis are as follows: n = 90 in 200 μM control morpholino group, n = 109 in 200 μM nfkb1 morpholino group, and n = 59 in 200 μM manba morpholino group. PHENOTYPE:
|

ZFIN is incorporating published figure images and captions as part of an ongoing project. Figures from some publications have not yet been curated, or are not available for display because of copyright restrictions. EXPRESSION / LABELING:
PHENOTYPE:
|