
- Title
-
Expression and function of ATP-dependent potassium channels in zebrafish islet β-cells
- Authors
- Emfinger, C.H., Welscher, A., Yan, Z., Wang, Y., Conway, H., Moss, J.B., Moss, L.G., Remedi, M.S., Nichols, C.G.
- Source
- Full text @ R Soc Open Sci

Whole-cell voltage-clamp of zebrafish β-cells reveals functional KATP channels. (a) Glucose tolerance in adult zebrafish. Blood glucose at each time point in (a) was compared between groups by ANOVA with Tukey's multiple comparisons on log-transformed datasets. n = 7–13 at each time point except for the baseline values which were 24. ***p < 0.001, group versus vehicle; ****p < 0.0001, group versus vehicle; p-values are from Tukey's multiple comparisons test following ANOVA of log-transformed values. †††p < 0.001, group versus glucose, also from Tukey's multiple comparisons test. Data in this panel are compiled from multiple injection experiments performed over several days. (b) Expression of eGFP in the fish pancreas allows visualization of β-cells in live adults (left image), isolated islets (middle image) and dispersed β-cells (right image). Scale is indicated for the live adult image. The middle and right images are at 20× and 40×, respectively. For image panels, bright-field and fluorescence images were superimposed for adult fish and whole islets. Adult fish bright-field image was contrast-enhanced prior to superimposing it with the fluorescence image to enhance visibility in the final combined image. (c) Whole-cell voltage-clamp detection of KATP in zebrafish β-cells. Voltage ramps (lower) were applied from −120 to +40 mV over 4 s. Following break-in, the initial ramp (blue) elicits large voltage-dependent K currents above −30 mV. These currents gradually run down in successive voltage ramps, and a weakly inwardly rectifying KATP conductance gradually increases to maximal (green) and then in turn runs down to baseline (red). Right panel shows currents between −120 and 0 mV for more clear visualization of KATP currents. |

ZFIN is incorporating published figure images and captions as part of an ongoing project. Figures from some publications have not yet been curated, or are not available for display because of copyright restrictions. EXPRESSION / LABELING:
|
|
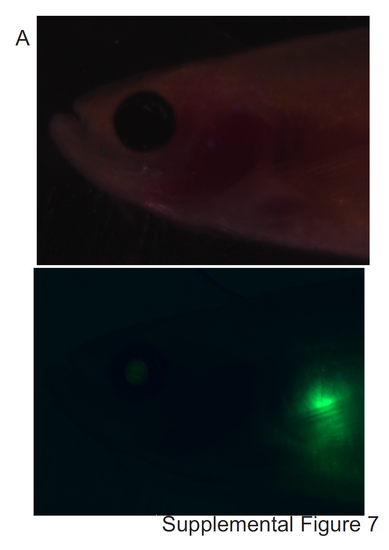
Original microscopy images in Figure 1. (A) Bright field (top) and green fluorescence (bottom) of an adult (12 week old) zebrafish anesthetized on its left side (10x). These images were combined and rotated prior to their use in Figure 1, as indicated in Figure 1 legend. Bright-field image was contrast-enhanced prior to being super-imposed with fluorescent image to improve visibility within final combined image. (B) Bright field (top) and green fluorescence (bottom) images of isolated zebrafish islets (20x). (C) Bright field (top) and green fluorescence (bottom) images of dispersed zebrafish β-cells (40x). (D) Co-localization of insulin and eGFP staining in zebrafish histological sections confirms specificity of insulin promoter driving eGFP (20x). 


EXPRESSION / LABELING:
|