
- Title
-
CNS angiogenesis and barriergenesis occur simultaneously
- Authors
- Umans, R.A., Henson, H.E., Mu, F., Parupalli, C., Ju, B., Peters, J.L., Lanham, K.A., Plavicki, J.S., Taylor, M.R.
- Source
- Full text @ Dev. Biol.
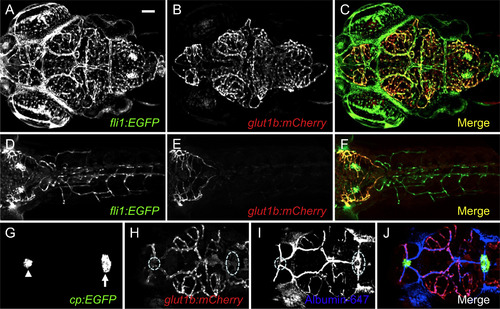
The zebrafish glut1b promoter drives expression in brain endothelial cells. Confocal microscopy of a live glut1b:mCherry; fli1a:EGFP double transgenic larva at 6 dpf. (A-C) mCherry is spatially restricted to the brain vasculature (B) and overlays with endothelial GFP expression from fli1a:EGFP (A, C). Shown here is a dorsal view of the brain vasculature (anterior, left). (D-F) mCherry is not expressed in peripheral endothelial cells. Shown here is the larval trunk (dorsal view) with partial inclusion of the mCherry-expressing hindbrain vasculature (anterior, left). (G-N) mCherry is not expressed in the vasculature of circumventricular organs. (G-J) glut1b:mCherry was crossed to cp:EGFP, an enhancer-trap line that expresses GFP in the myelencephalic (white arrow in G) and diencephalic (white arrowhead in G) choroid plexus. The choroid plexus regions are outlined (white dash) in (H). For G-J, albumin Alexa Fluor 647 (pseudo-colored in blue) was injected as a tracer to visualize blood vessels. Confocal images were captured in the plane of GFP expression. Note the lack of colocalization between mCherry (BBB vessels) and blue (all blood vessels) in the choroid plexus. Scale bar in A is 50 µm for all images. EXPRESSION / LABELING:
|

CNS angiogenesis and barriergenesis occur simultaneously. glut1b:mCherry; fli1a:EGFP double transgenic embryos were imaged by time-lapse confocal microscopy. Shown here are snapshots at 6-h intervals beginning at the onset of CNS angiogenesis (30 hpf). Note that mCherry is immediately expressed as brain endothelial cells migrate into the brain parenchyma from the PHBCs (arrows in 36 hpf panels). See 30 h time-lapse Videos 1 for more detail. MsV, mesencephalic vein; MCeV, mid-cerebral vein; PHBC, primordial hindbrain channel, E, eye. Scale bar in top left image is 50 µm for all images. |

gpr124 mutants have reduced CNS angiogenesis. (A) Whole-exome sequencing was used to identify the gpr124 mutation. Only one gene on chromosome 8 was found to have a nonsense mutation. (B) A premature stop codon was found in gpr124 resulting in a Q981X mutation located in the intracellular loop between transmembrane domains 5 and 6 (not to scale). (C) At 3 dpf, gpr124 mutants show no CNS angiogenesis and no glut1b:mCherry expression (see Video 2). (D) At 6 dpf, gpr124 mutants form abnormal vessels on the brain surface between the mesencephalic vein and the eye (white dashed outline in Day 6 Merge and Supplemental Figure 1), CNS angiogenesis partially recovered where the mid-cerebral vein sprouts into the parenchyma, and few of these vessels begin to express glut1b:mCherry (arrows), including expression in the mesencephalic vein (arrowheads). The 3D distribution of brain vasculature can be seen more clearly in Video 2. (E) Confocal images of the optic tectum vasculature from wild type (WT) and gpr124 mutant adults at 3 months. Scale bar (C, top left image) is 50 µm for all images in (C) and (D). Scale bar is 100 µm (E, top left image). EXPRESSION / LABELING:
PHENOTYPE:
|

Visualization of blood-brain barrier maturation. (A) Representative images of plvap:EGFP;glut1b:mCherry double transgenic embryos on day 2 and 6 dpf. Green and red channels were captured using the same intensities on day 2 and day 6 to illustrate the decrease in GFP expression and the increase in mCherry expression. Scale bar (A, top left image) is 50 µm for all images. (B) GFP fluorescence intensity was measured in brain parenchymal (P) and brain surface (S) endothelial cells (n=18 per group) and the ratio of parenchymal/surface intensity (GFP P/S Ratio) was plotted. Note the significant decrease of GFP expression in parenchymal endothelial cells over time. (C) Relative mCherry fluorescence intensity was measured in parenchymal endothelial cells (n=18 per group) and plotted. Note the significant increase in mCherry expression over time. See volume rendered Video 3 to better visualize surface and parenchymal expression of GFP and mCherry. Error bars represent ±S.E.M.; * p<0.0001, Unpaired t-test. |
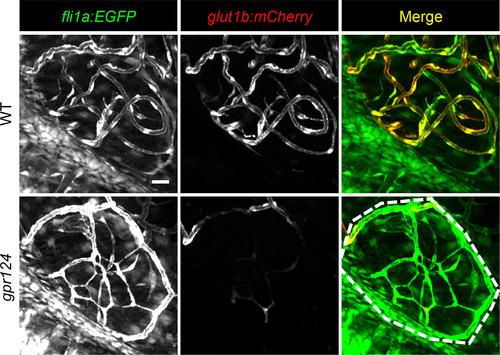
gpr124 mutants form abnormal vessels on the brain surface at 6 dpf. Shown here is a high magnification of the images shown in Figure 3D. Scale bar in top left image is 10 µm for all images. |

ZFIN is incorporating published figure images and captions as part of an ongoing project. Figures from some publications have not yet been curated, or are not available for display because of copyright restrictions. EXPRESSION / LABELING:
PHENOTYPE:
|
Reprinted from Developmental Biology, 425(2), Umans, R.A., Henson, H.E., Mu, F., Parupalli, C., Ju, B., Peters, J.L., Lanham, K.A., Plavicki, J.S., Taylor, M.R., CNS angiogenesis and barriergenesis occur simultaneously, 101-108, Copyright (2017) with permission from Elsevier. Full text @ Dev. Biol.