
- Title
-
Small Molecule Inhibition of ERK Dimerization Prevents Tumorigenesis by RAS-ERK Pathway Oncogenes
- Authors
- Herrero, A., Pinto, A., Colón-Bolea, P., Casar, B., Jones, M., Agudo-Ibáñez, L., Vidal, R., Tenbaum, S.P., Nuciforo, P., Valdizán, E.M., Horvath, Z., Orfi, L., Pineda-Lucena, A., Bony, E., Keri, G., Rivas, G., Pazos, A., Gozalbes, R., Palmer, H.G., Hurlstone, A., Crespo, P.
- Source
- Full text @ Cancer Cell

ZFIN is incorporating published figure images and captions as part of an ongoing project. Figures from some publications have not yet been curated, or are not available for display because of copyright restrictions. PHENOTYPE:
|
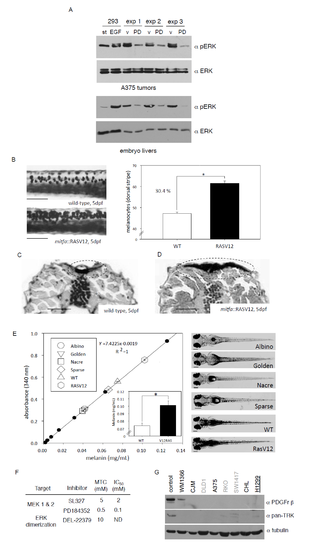
Related to Figure 7. DEL-22379 antineoplastic effects are specifically based upon its ability to impede ERK dimerization. (A) A375 cells were xenografted on the upper CAM of chick embryos. After 3 days, embryos were treated with vehicle (v) (PBSDMSO 1%) or with PD-184352 (10 μM), refreshed every 12 hr. Experiments were terminated on day 8, tumors were excised and ERK phosphorylation levels in the tumors and in the corresponding embryo livers were determined by western blotting. Data shows representative samples from three independent experiments. (B) Melanoma onset in RASV12-expressing zebrafish larvae. Dorsal view of a section of the dorsal stripe showing a 30.4 % increase in melanocytes in RASV12 animals at 5 dpf. Mean ± SEM (n=20 animals). * p < 0.05, independent samples t-test. Scale bar: 100 μm. (C, D) Dorsal region of transverse section stained with H&E. The dorsal stripe is circled. Scale bar: 50 μm (E) Inhibition of Ras-ERK pathway signaling antagonizes melanoma onset in RASV12- expressing zebrafish larvae. For determining melanin contents a calibration curve (black solid dots) was generated by measuring absorbance at 340 nm for synthetic melanin standards. Melanin contents for 5-dfp Albino, Golden, Nacre, and Sparse mutant, WT and RASV12-transgenic animals. Scale bar: 50 μm. Mean ±: SEM (n = 5 wells). (F) Maximum tolerated concentration and IC50 values of small molecule inhibitors for zebrafish (ND, not determined). (G) PDGFr-β and TRK A/B expression levels in melanoma and colorectal cancer cell lines, monitored in a panel of lines included in Fig 3A. Control: NIH3T3 cells for PDGFr-β, mouse brain extract for TRK A/B. PHENOTYPE:
|
Reprinted from Cancer Cell, 28, Herrero, A., Pinto, A., Colón-Bolea, P., Casar, B., Jones, M., Agudo-Ibáñez, L., Vidal, R., Tenbaum, S.P., Nuciforo, P., Valdizán, E.M., Horvath, Z., Orfi, L., Pineda-Lucena, A., Bony, E., Keri, G., Rivas, G., Pazos, A., Gozalbes, R., Palmer, H.G., Hurlstone, A., Crespo, P., Small Molecule Inhibition of ERK Dimerization Prevents Tumorigenesis by RAS-ERK Pathway Oncogenes, 170-82, Copyright (2015) with permission from Elsevier. Full text @ Cancer Cell