
- Title
-
Imaging the adult zebrafish cone mosaic using optical coherence tomography
- Authors
- Huckenpahler, A.L., Wilk, M.A., Cooper, R.F., Moehring, F., Link, B.A., Carroll, J., Collery, R.F.
- Source
- Full text @ Vis. Neurosci.

Visualization of the zebrafish cone mosaic using en face volume projection images. (A, C) The straight slab method in the native Bioptigen analysis software results in an en face volume projection with different retinal layers included at different locations within the volume, thus the cone mosaic is only visible in some parts of the en face image. (B, D) Using a custom contour that follows a single outer hyper-reflective band results in an en face projection of that layer, in this case the UV cone mosaic. |

Deriving the lateral scale of in vivo OCT images of the fli1:eGFP zebrafish retina. (A) En face image generated by positioning the custom contour within the retinal nerve fiber layer. Measurements (in pixels) were taken between multiple blood vessel branch points (white dots). (B) Corresponding ex vivo fluorescent microscopy image of the same retina, with measurements (in µm) taken between the same blood vessel branch points in (A). The OCT:microscopy measurements were averaged for each eye and used to determine the size of the OCT scan in µm. A scaling coefficient for each scan was calculated as the ratio between the actual size of the OCT scan to the nominal OCT scan size (in this case, 1200 µm). (C) The scaling coefficient for each scan was plotted against the axial length for that eye and fit with a linear model. Error bars represent one standard deviation for each eye. |

Visualization of the UV and red/green photoreceptor layers. (A) B scan with contour placed at the UV layer and (B) the same B scan with the contour moved to the red/green layer. The resultant images generated produce en face images of (C) the UV cone layer and (D) the red/green cone layer. A false-colored overlay (E) of these two layers showing the alternating/interleaved geometry of these photoreceptor sublamina. Scale bar = 200 µm. (F) A cropped region shows the interleaved red/green and UV cone mosaics. |
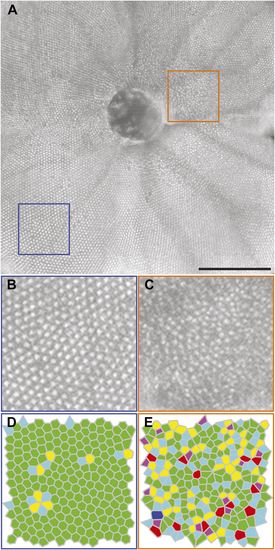
Regional differences in the topography of the zebrafish cone mosaic. (A) Montage of five en face images of the adult zebrafish UV cone sublamina. Scale bar = 200 µm. Cropped images of the (B) peripheral adult growth and (C) parapapillary larval growth, showing differences in the percentage of six-sided cells within the cone mosaic. The corresponding Voronoi diagrams indicate the number of sides for each Voronoi cell (purple = 4; light blue = 5; green = 6; yellow = 7; red = 8; dark blue = 9). (D) The peripheral adult growth (blue box in A) shows a regular, crystalline mosaic, indicated by the high number of six-sided Voronoi cells (green cells). (E) In contrast, the parapapillary larval growth (orange box in A) shows disorganized, random packing. |